GeoInquiries™ provide a complete learning package–maps and questions. They were designed for the one computer classroom and users with limited experience with GIS. The interactive activities can also be used by individual and pairs of students. As with any lesson, preparation is the key–preview the activity and anticipate challenges your students may encounter. Note the use of the term inquiry. Maps only answer questions if ask them. Examine the diagram of the geoinquiry process. Maps are the tool geographers use to examine spatial relationships.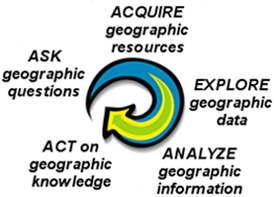
- Spatial Variation
How are things distributed on the landscape?
What patterns are observed?
How does the distribution of attributes differ within and between maps? - Spatial Interaction
How are places connected?
Which people, goods and ideas move from one area to another?
How does the physical landscape facilitate or impede interaction?
How do people /government policies upport or inhibit interactions?
Why do people move? - Spatial Association
Which “things” have a similar spatial distribution?
How are “variables” related? e.g., settlements and rivers; per capita GDP and life expectancy
To what extent do those relationships help to answer the “why there” question?
There are some basic GIS skills that will equip you with techniques to modify the maps for further exploration. These skills fall into three basic categories—map management, map modification, and authoring.
Map Management
- Saving a map
- Sharing a map so that your students can access it without being logged in
- Searching for a map
- Capturing a map’s URL
Map Modification
- How to add Map Notes
- Adding layers
- Change Style--change the symbols on the map
- Filtering
- Changing the order of the layers
Presentation
- Creating a map-based presentation
- Sample presentation (courtesy of iSTEM)
- Creating a story map journal app
Handouts
- How to Annotate a Map
- How to Retrieve a GeoInquiry Map
- How to Hack a GeoInquiry Handout
- Adding Data from a Spreadsheet (World and US cities)
- Adding Data from a Spreadsheet (Virginia cities, Chesapeake Bay data) includes adding charts
Spreadsheets
- Spreadsheet for World Cities (population through time)
- Spreadsheet for US Cities (1790 – 1900)
- Spreadsheet for US Cities (1800 – present)
- Spreadsheet for Virginia Population (1790 -2010)
- Spreadsheet for Chesapeake Bay Buoys