Why use maps?
Maps are a unique way to visualize data. Maps tie data to specific places. As Tobler’s first law of geography states, “Everything is related to everything else, but near things are more related than distant things.” Online maps are rich sources of data. Images, links to web sites for further information, and explanations can all be included in a pop-up tied to the map’s data table.
There are basic concepts that make maps special or it it spatial? Examine the map of daylight hours. Click on the symbols on the map to acquire more information to provide a partial answer to the questions posed beneath the map.
Http iframes are not shown in https pages in many major browsers. Please read this post for details.- How are the hours of daylight distributed across Earth on specific dates? (spatial distribution)
- How does the distribution of daylight hours differ from place to place, from season to season? (spatial variation)
- What other “variables: may share a similar pattern of distribution? (spatial association)
The numerical data in maps can be used to reinforce math skills dealing with place value and decimals. Interpretation of symbols used to represent data provides experience with informational text.
Remember everything is GEOGRAPHIC because it happens somewhere.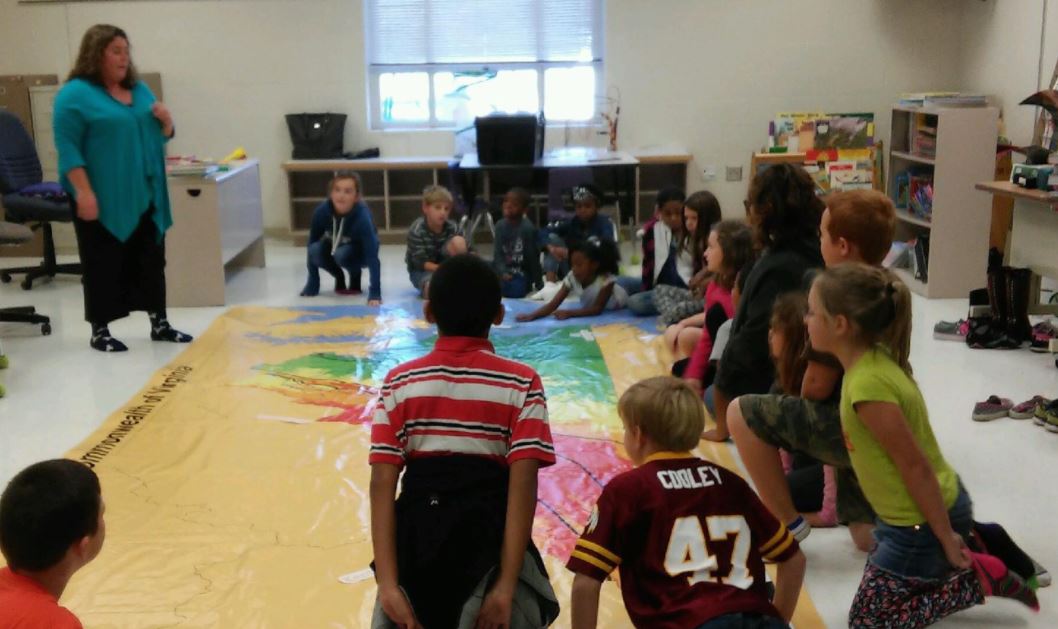
Order form for Virginia Floor Map