What is De novo transcriptome reconstruction?
De novo transcription reconstruction refers to assembling a transcript that does not have a a specified genome sequence. For this example, we will be using RNA-seq data and the galaxy platform.
Performing De novo transcriptome reconstruction on RNA Seq in Galaxy
The process below can take a while, about 5 hours or more, due to galaxy job completion time.
We will first check the quality of our reads, groom them for cleaner data, recheck quality, map, reconstruction, assembly,
To use files paste into your web browser to download then upload to galaxy:
We will be using the following files for our project:
https://zenodo.org/record/583140/files/G1E_rep1_forward_read_%28SRR549355_1%29
https://zenodo.org/record/583140/files/G1E_rep1_reverse_read_%28SRR549355_2%29
https://zenodo.org/record/583140/files/G1E_rep2_forward_read_%28SRR549356_1%29
https://zenodo.org/record/583140/files/G1E_rep2_reverse_read_%28SRR549356_2%29
https://zenodo.org/record/583140/files/Megakaryocyte_rep1_forward_read_%28SRR549357_1%29
https://zenodo.org/record/583140/files/Megakaryocyte_rep1_reverse_read_%28SRR549357_2%29
https://zenodo.org/record/583140/files/Megakaryocyte_rep2_forward_read_%28SRR549358_1%29
https://zenodo.org/record/583140/files/Megakaryocyte_rep2_reverse_read_%28SRR549358_2%29
Please note that in addition to the files listed above we will also require a reference genome for mouse which can be found at the following address:
https://zenodo.org/record/583140/files/RefSeq_reference_GTF_%28DSv2%29
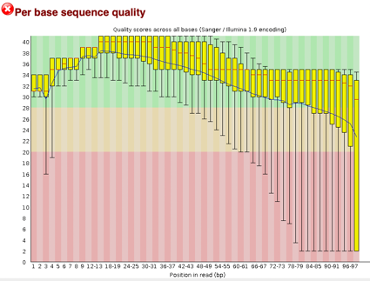
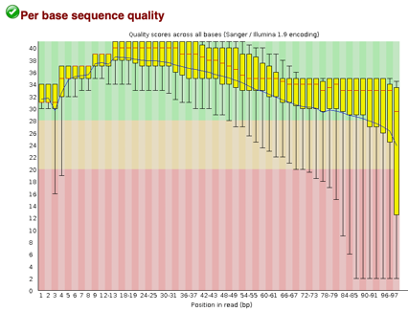
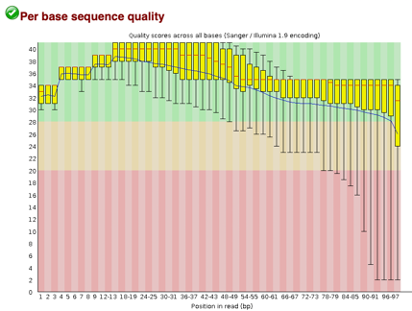
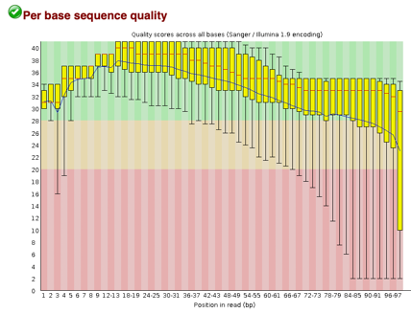
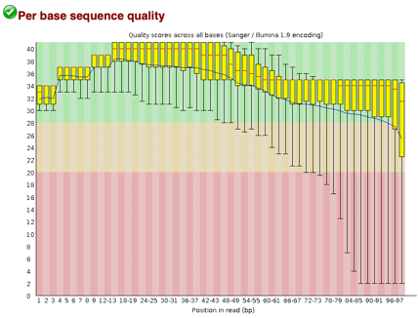
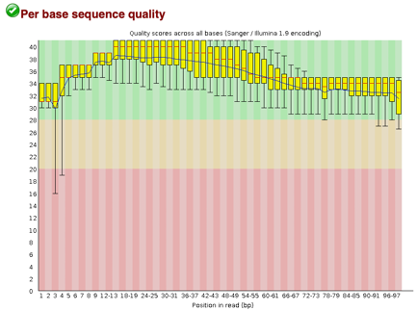
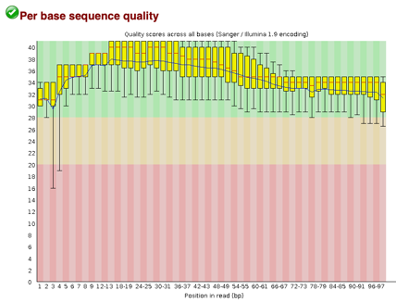
Before Trimming
After uploading we will use the FASTQC tool in Galaxy to access the sequence quality, pictured below,
Line 1: G1E forward 1, G1E reverse 1, G1E forward 2, G1E reverse 2
Line 2: Megakaryocyte forward 1, Megakaryocyte reverse 1, Megakaryocyte forward 2, Megakaryocyte reverse 2
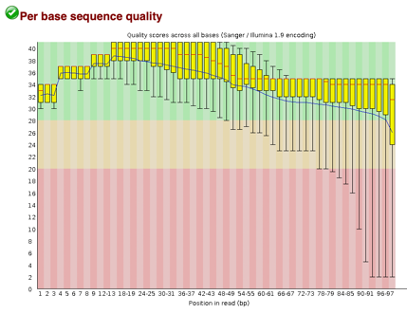
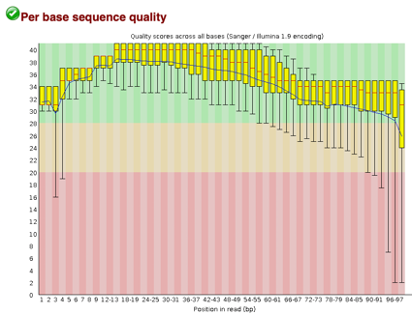
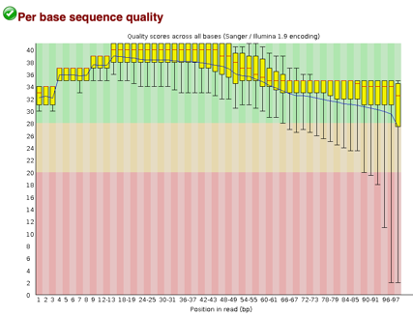
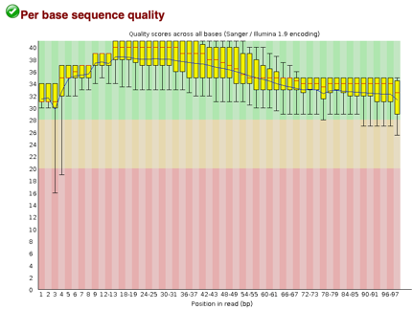
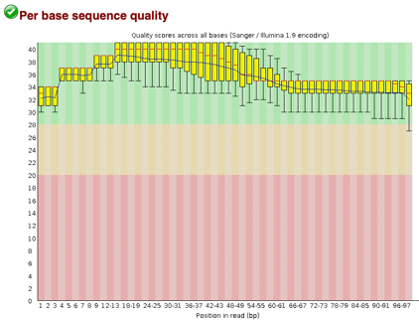
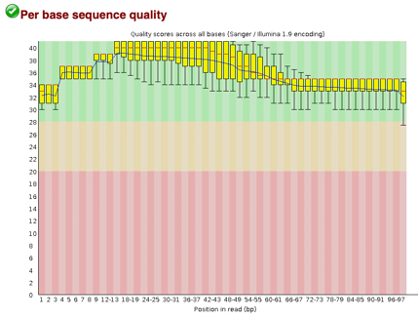
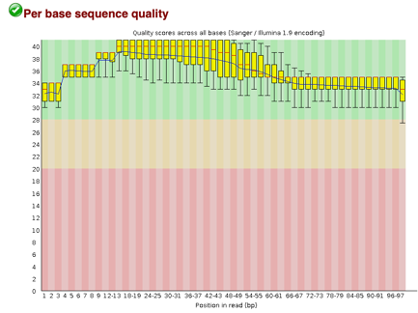
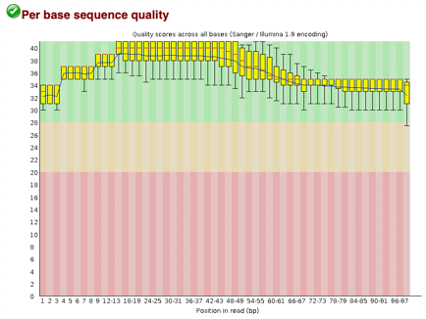
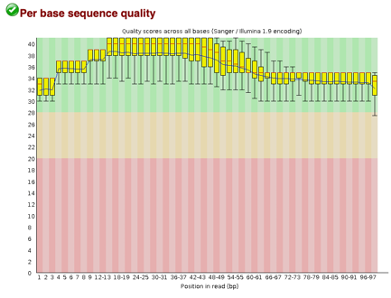
After Trimming
As we can see, most of our sequences currently have less than optimal quality, therefore we will groom the data to make it cleaner. We will utilize the Trimmomatic tool with pair end reads for each of our four data sequences and follow up with an additional FASTQC on the output data. As we can see below our sequence quality has dramatically improved and we are now ready to continue onto mapping and reconstruction.
Line 1: G1E forward 1, G1E reverse 1, G1E forward 2, G1E reverse 2
Line 2: Megakaryocyte forward 1, Megakaryocyte reverse 1, Megakaryocyte forward 2, Megakaryocyte reverse 2
Mapping and Reconstruction
To map our paired end reads we will use the HISAT2 tool. We will use our paired read outputs from Trimmomatic ensuring we pair the correct sequences (complimentary forward and reverse strands). This will produce 4 BED files, one for each pair, 2 for each cell line.
HISAT2: alignment tool that uses FASTA and FASTQ file inputs, either single or paired end assembly
For the first portion of assembling the transcript we will use the StringTie tool and plug in the newly generated BAM files from HISAT2. This will provide the transcriptomes we will use to complete the reconstruction. For our reference annotation we will use the reference sequence (provided above).
StringTie: uses a short, mapped reads file to determine transcript assembly and quantification (not to be confused with StringTie merge)
Secondly, we will use GFFcompare. This tool allows us to annotate the transcripts we just produced from StringTie. To do this we will select the output files from StringTie as our input, use the refs data as our Reference annotation and use the Mouse (Music Musculus) mm10 as our sequence data.
GFFCompare: uses a reference annotation to compare transcripts that have been previously assembled using another tool
GFF Compare data output was as follows:
# gffcompare v0.11.2 | Command line was: #gffcompare -r ref_annotation -s ref_seq.fa -e 100 -d 100 -p TCONS StringTie_on_data_57__Assembled_transcripts StringTie_on_data_58__Assembled_transcripts StringTie_on_data_59__Assembled_transcripts StringTie_on_data_60__Assembled_transcripts # #= Summary for dataset: StringTie_on_data_57__Assembled_transcripts # Query mRNAs : 280 in 263 loci (121 multi-exon transcripts) # (16 multi-transcript loci, ~1.1 transcripts per locus) # Reference mRNAs : 274 in 183 loci (250 multi-exon) # Super-loci w/ reference transcripts: 75 #-----------------| Sensitivity | Precision | Base level: 12.9 | 38.8 | Exon level: 23.6 | 45.1 | Intron level: 30.7 | 82.8 | Intron chain level: 8.0 | 16.5 | Transcript level: 7.3 | 7.1 | Locus level: 10.9 | 7.6 | Matching intron chains: 20 Matching transcripts: 20 Matching loci: 20 Missed exons: 861/1332 ( 64.6%) Novel exons: 212/696 ( 30.5%) Missed introns: 747/1163 ( 64.2%) Novel introns: 46/431 ( 10.7%) Missed loci: 108/183 ( 59.0%) Novel loci: 168/263 ( 63.9%) #= Summary for dataset: StringTie_on_data_58__Assembled_transcripts # Query mRNAs : 296 in 273 loci (141 multi-exon transcripts) # (22 multi-transcript loci, ~1.1 transcripts per locus) # Reference mRNAs : 274 in 183 loci (250 multi-exon) # Super-loci w/ reference transcripts: 76 #-----------------| Sensitivity | Precision | Base level: 13.2 | 33.6 | Exon level: 24.4 | 44.9 | Intron level: 31.4 | 80.9 | Intron chain level: 9.6 | 17.0 | Transcript level: 8.8 | 8.1 | Locus level: 13.1 | 8.8 | Matching intron chains: 24 Matching transcripts: 24 Matching loci: 24 Missed exons: 845/1332 ( 63.4%) Novel exons: 224/724 ( 30.9%) Missed introns: 736/1163 ( 63.3%) Novel introns: 54/451 ( 12.0%) Missed loci: 107/183 ( 58.5%) Novel loci: 172/273 ( 63.0%) #= Summary for dataset: StringTie_on_data_59__Assembled_transcripts # Query mRNAs : 251 in 234 loci (105 multi-exon transcripts) # (16 multi-transcript loci, ~1.1 transcripts per locus) # Reference mRNAs : 274 in 183 loci (250 multi-exon) # Super-loci w/ reference transcripts: 60 #-----------------| Sensitivity | Precision | Base level: 8.1 | 34.7 | Exon level: 14.8 | 37.7 | Intron level: 20.0 | 81.8 | Intron chain level: 4.4 | 10.5 | Transcript level: 4.0 | 4.4 | Locus level: 6.0 | 4.7 | Matching intron chains: 11 Matching transcripts: 11 Matching loci: 11 Missed exons: 1001/1332 ( 75.2%) Novel exons: 191/523 ( 36.5%) Missed introns: 888/1163 ( 76.4%) Novel introns: 35/285 ( 12.3%) Missed loci: 123/183 ( 67.2%) Novel loci: 154/234 ( 65.8%) #= Summary for dataset: StringTie_on_data_60__Assembled_transcripts # Query mRNAs : 118 in 116 loci (50 multi-exon transcripts) # (2 multi-transcript loci, ~1.0 transcripts per locus) # Reference mRNAs : 273 in 182 loci (249 multi-exon) # Super-loci w/ reference transcripts: 32 #-----------------| Sensitivity | Precision | Base level: 3.4 | 40.4 | Exon level: 5.9 | 33.6 | Intron level: 9.0 | 89.7 | Intron chain level: 2.0 | 10.0 | Transcript level: 1.8 | 4.2 | Locus level: 2.7 | 4.3 | Matching intron chains: 5 Matching transcripts: 5 Matching loci: 5 Missed exons: 1167/1321 ( 88.3%) Novel exons: 77/232 ( 33.2%) Missed introns: 1023/1153 ( 88.7%) Novel introns: 11/116 ( 9.5%) Missed loci: 150/182 ( 82.4%) Novel loci: 71/116 ( 61.2%) Total union super-loci across all input datasets: 396 | Status | HISAT2 on data 26 and data 25: aligned reads (BAM) |
| Status | HISAT2 on data 26 and data 25: aligned reads (BAM) |
| Assigned | 536859 |
| Unassigned_Unmapped | 802 |
| Unassigned_Read_Type | 0 |
| Unassigned_Singleton | 0 |
| Unassigned_MappingQuality | 0 |
| Unassigned_Chimera | 4925 |
| Unassigned_FragmentLength | 0 |
| Unassigned_Duplicate | 0 |
| Unassigned_MultiMapping | 348421 |
| Unassigned_Secondary | 0 |
| Unassigned_NonSplit | 0 |
| Unassigned_NoFeatures | 244990 |
| Unassigned_Overlapping_Length | 0 |
| Status | HISAT2 on data 30 and data 29: aligned reads (BAM) |
| Status | HISAT2 on data 30 and data 29: aligned reads (BAM) |
| Assigned | 629853 |
| Unassigned_Unmapped | 512 |
| Unassigned_Read_Type | 0 |
| Unassigned_Singleton | 0 |
| Unassigned_MappingQuality | 0 |
| Unassigned_Chimera | 7694 |
| Unassigned_FragmentLength | 0 |
| Unassigned_Duplicate | 0 |
| Unassigned_MultiMapping | 516965 |
| Unassigned_Secondary | 0 |
| Unassigned_NonSplit | 0 |
| Unassigned_NoFeatures | 311733 |
| Unassigned_Overlapping_Length | 0 |
| Unassigned_Ambiguity | 496119 |
| Status | HISAT2 on data 34 and data 33: aligned reads (BAM) |
| Status | HISAT2 on data 34 and data 33: aligned reads (BAM) |
| Assigned | 276145 |
| Unassigned_Unmapped | 325 |
| Unassigned_Read_Type | 0 |
| Unassigned_Singleton | 0 |
| Unassigned_MappingQuality | 0 |
| Unassigned_Chimera | 7886 |
| Unassigned_FragmentLength | 0 |
| Unassigned_Duplicate | 0 |
| Unassigned_MultiMapping | 358737 |
| Unassigned_Secondary | 0 |
| Unassigned_NonSplit | 0 |
| Unassigned_NoFeatures | 178164 |
| Unassigned_Overlapping_Length | 0 |
| Status | HISAT2 on data 38 and data 37: aligned reads (BAM) |
| Status | HISAT2 on data 38 and data 37: aligned reads (BAM) |
| Assigned | 20886 |
| Unassigned_Unmapped | 44 |
| Unassigned_Read_Type | 0 |
| Unassigned_Singleton | 0 |
| Unassigned_MappingQuality | 0 |
| Unassigned_Chimera | 202 |
| Unassigned_FragmentLength | 0 |
| Unassigned_Duplicate | 0 |
| Unassigned_MultiMapping | 33210 |
| Unassigned_Secondary | 0 |
| Unassigned_NonSplit | 0 |
| Unassigned_NoFeatures | 8430 |
| Unassigned_Overlapping_Length | 0 |
| Unassigned_Ambiguity | 13004 |
(65 multi-transcript, ~1.8 transcripts per locus) 695 out of 695 consensus transcripts written in gffcmp.combined.gtf (0 discarded as redundant) FeatureCounts
GffCompare also produced a combined transcripts file which, I was able to use with HISAT2 data for the feature counts tool in Galaxy.
featurecounts: allows you to measure the amount of expression happening in a gene.
A summary of the 4 featurecounts files can be found below:
DESeq 2
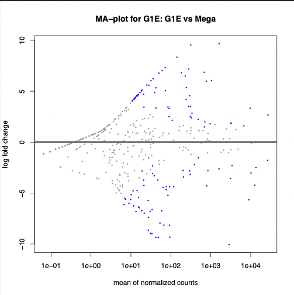
DESeq2: uses count tables as input to determine differentially expressed features. We are interested in the up and down regulation of the transcripts, p values, and associations with the gene. This tools outputs two file formats. First a tabular file on which p-values and log2 values are shown. The second file outputs graphical representations of the data , see below.
The total number of transcripts that have a significant p-value are 197 transcripts.
When looking for down regulation we will look to the log2 column for negative number associations
Downregulated: 215 G1E transcripts
When looking for up regulation we will look to the log2 column for positive number associations
Upregulated: 189 G1E transcripts
Results of RNA-seq transcriptome reconstruction:
The G1E seq 1 and 2 compliment eachother better than the Mega datasets 1 and 2. The comparison between the two sets shows a high variation of counts between Mega and G1E. We can see the greatest amount of alignment for each data set is with its companion set, followed by the counts of G1E data set 1 and Mega data set 2.
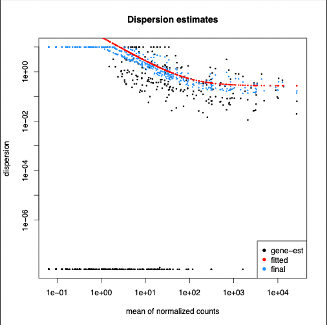
The dispersion estimates above show that many of the transcript dispersions were at a minimum however, we can also see our fitted and final dispersion estimates align with a good portion of the given data flow.
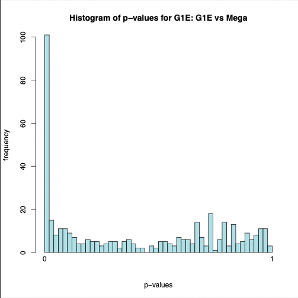
As we can see in the plots above the p-values correlating to the transcripts of G1E showed various amounts of change in expression however, a decent amount had no change.
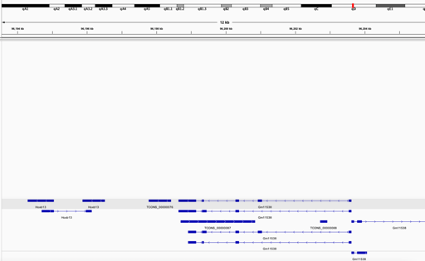
Results of Transcript expressions (using IGV)
The GTF data set from our GFFcompare file showed the following genes for G1E and Megakarocyte cell line at the chromosomal location indicated
chr11:96193539-96206376 on the mouse mm10 gene model.
Hoxb13 (3 variations)
TCONS_00000076
TCONS_00000087
TCONS_00000088
Gm1538 (6 variations, 1 partially located in the region(TSS and 1 exons)