
The following will show unique exon and CpG intersections. These intersections are interesting to the bioinformation as they can be used to determine CpG islands which are known for their importance as gene markers, stabilization in epigenetic memory, gene silencing and many other gene features. For this example, we will be looking at a region located in the region 5q31. We will determine how many unique exons intersect a CpG region and how many do not intersect a CpG region. We will also determine how many unique CpG regions intersect an exon and how many do not intersect exons.
First we will visualize our data in the IGV genome browser. We will then continue to determine exon and CpG intersection in Galaxy. The files containing the exons and CpGs have already been provided in bed format.
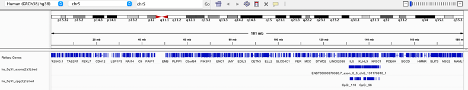
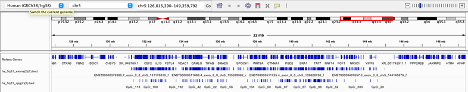
Upop opening the IGV browser I selected Human (GRCh38/hg38) and selected chromosome 5. Then I uploaded my 2 bed files, one for exons and one for CpGs. IGV then Loaded two tracks. This allowed me to have a visualization of the intersections and ensure correct chromosomal placement, however they were extremely numerous due to the number of exons and CpGs provided (see below), therefore, I continued in Galaxy.
IGV Browser visualization of exon and CpG data files
Galaxy
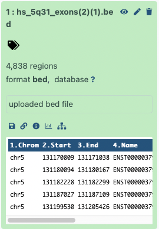
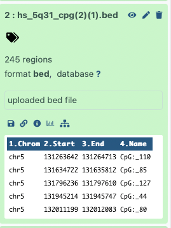
I then continued on the galaxy browser usegalaxy.com. I uploaded the two previously used files in bed format, via the upload data on the galaxy website. Galaxy confirmed a total of 4,838 exon regions and 245 CpG regions.
Finding exon intersections of CpG
We will now proceed to navigate tools to use the tool BED intersect intervals.
This tool allows us to find the intersection regions of our two files.
For the first output, we will be looking for how many unique exons intersect with a CpG region.
Therefore we will select the exon file as file A and CpG file as file B.
We will also select yes for the option
Write the original A entry _once_ if _any_ overlaps found in B.
And select what should be written for our output file:
Write the original entry in A for each overlap (-wa)
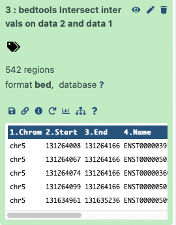
Our result is 542 regions, or 542 unique exons intersect with CpGs in this region.
Next, we will find out how many exons do not overlap CpGs
We will use the same tool again with the same perameters however, this time we will use the
Report only those alignments the **do not** overlap the BED file option.
The output was 4296 regions.
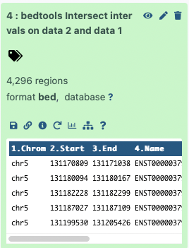
- This makes sense: 4838 original number of exons
-542 number of intersecting exons
= 4296 number of exons that do not intersect
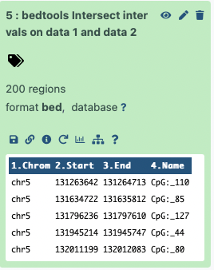
Finding CpG intersections with exons
For this portion we will be looking for CpGs that intersect exons and do not intersect.
We will use the same steps as above however we will choose the CpG bed file as our first file (file A to intersect with file B) and the exons BED as our second file.
For CpGs that intersect exons we had a result of 200 regions
And for our CpG regions that do not intersect we got 45 regions.
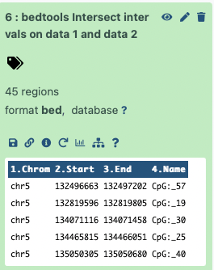
This makes sense since our original number of CpG regions were 245 and our results
200 – CpGs intersecting with exons
+ 45 – CpGs did not intersect with exons
= 245