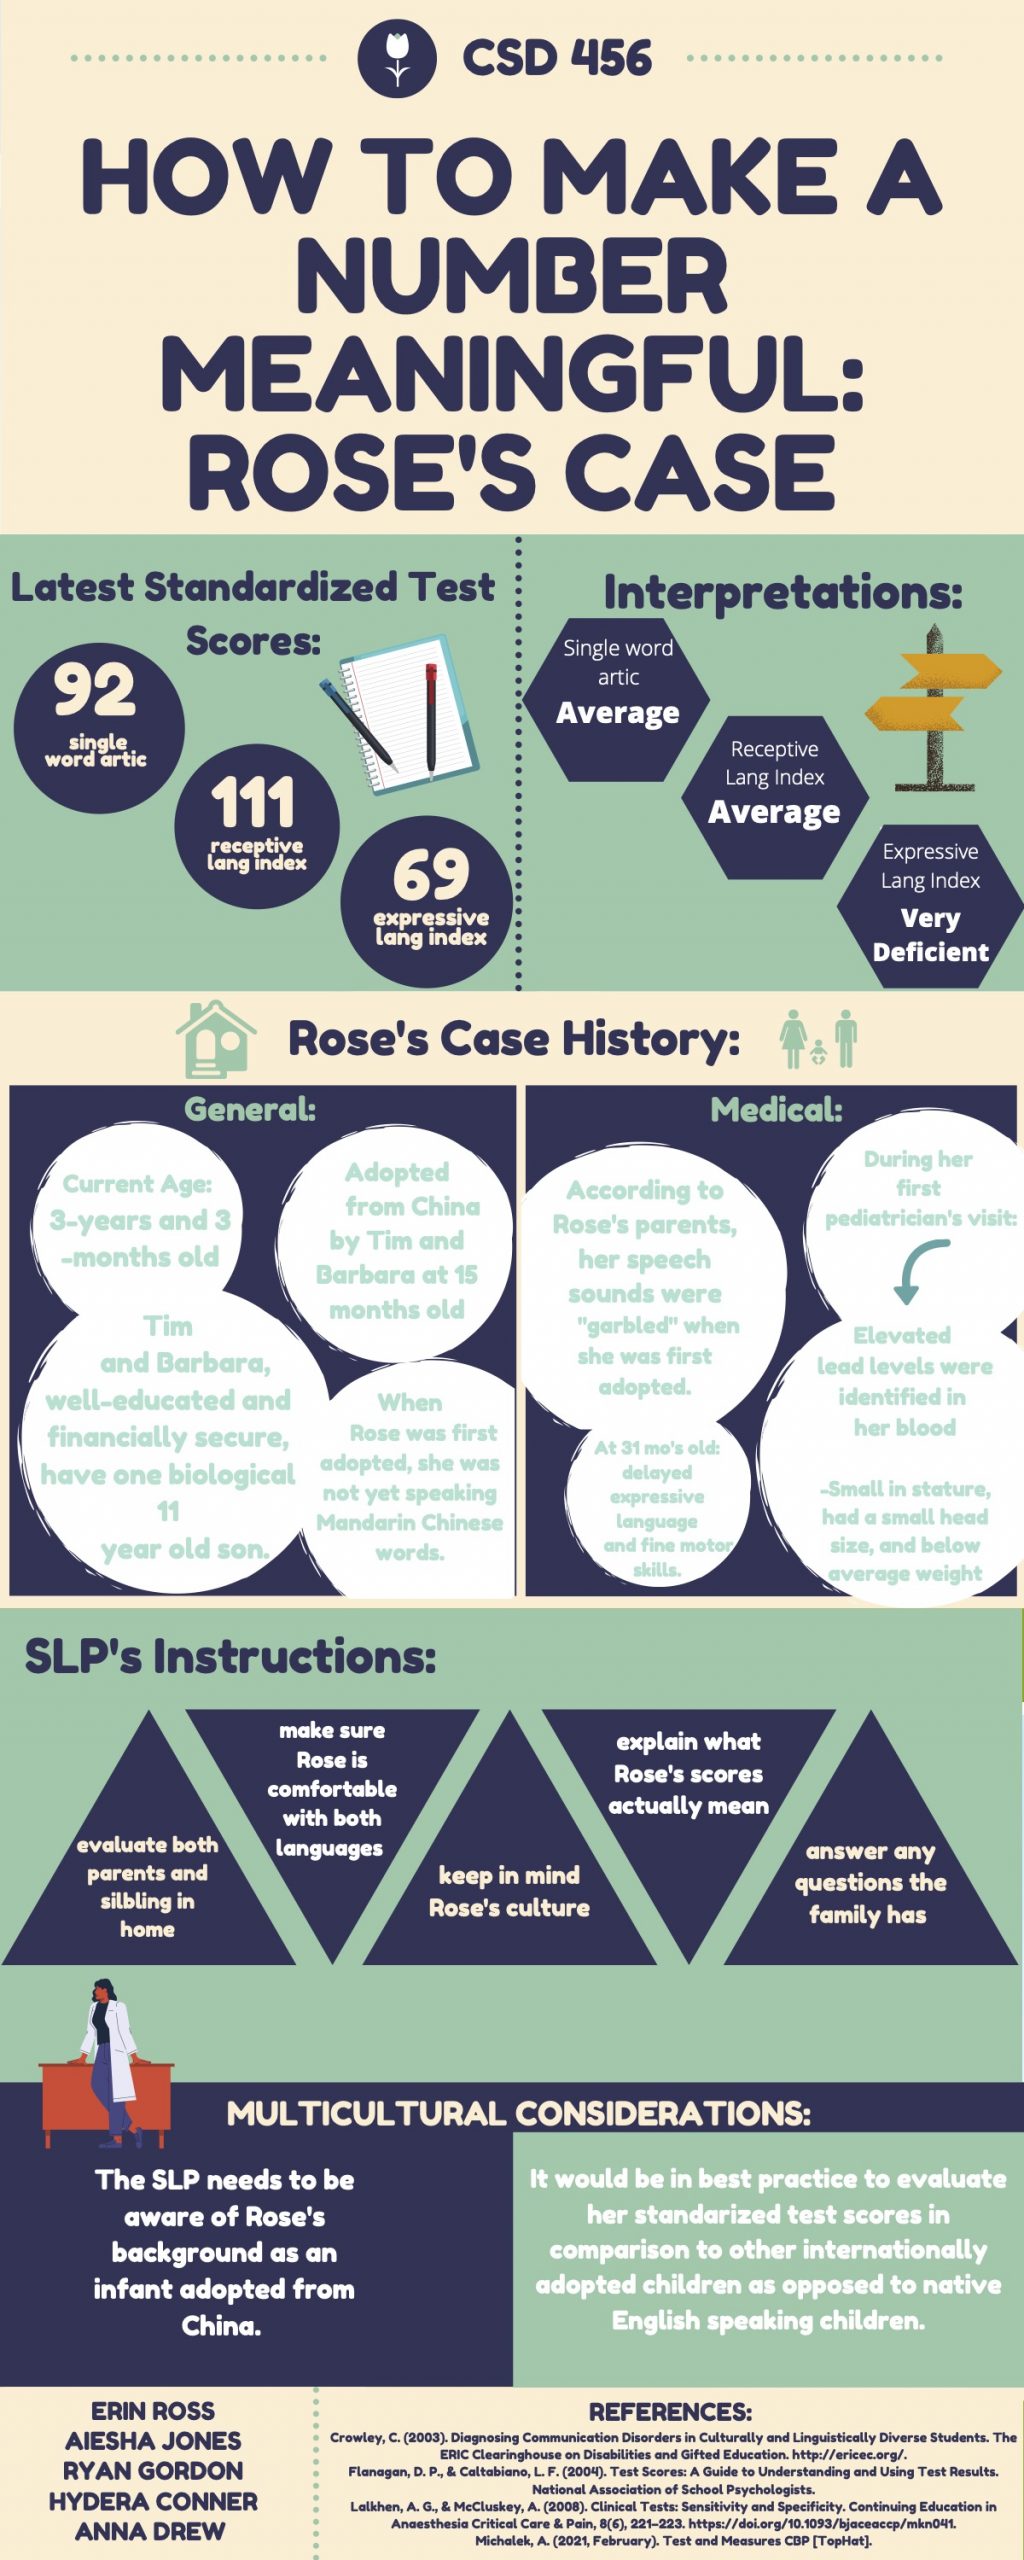
During this assignment my group members Hydera Conner, Anna Drew, Ryan Gordon, Erin Ross, and I created an infographic analyzing test scores of a client to show the relationship between their scores and possible severities. We were able to demonstrate our critical thinking skills and ability to interpret numerical data, to then translate and apply to various components.