ArcGIS Map Assignments
Below are examples of the GIS projects I completed during the course, each demonstrating the application of geographic information systems to criminological and social science research questions.
Assignment 1 – Getting Started with GIS: Introductory Maps
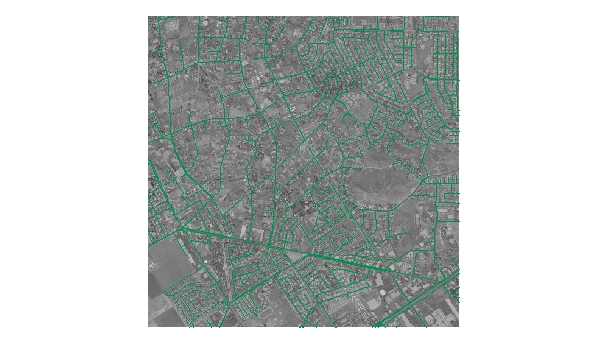
For this assignment, I created a series of four introductory maps using ArcGIS based on the Getting Started with GIS tutorial. The exercise involved accessing the ODU GIS Virtual Desktop, downloading and organizing geospatial data, opening ArcMap software, and practicing core GIS skills such as locating data, creating and saving maps, and manipulating map layers. This project provided foundational experience with GIS technology and prepared me for more advanced mapping assignments throughout the course.


Assignment 2 – Hurricane Etang and NAFTA Maps
For this assignment, I created two detailed maps using ArcGIS: one visualizing the impact of Hurricane Etang and one exploring the geographic and economic connections between NAFTA countries. The project required working independently from written instructions, downloading and organizing geospatial data, and applying GIS skills to produce accurate, layered maps. This assignment helped strengthen my ability to navigate complex data structures and follow professional GIS workflows.
Assignment 3 – Relation of Crime and Poverty in Riverside, CA (January 2002)
For this assignment, I applied ArcGIS tools to investigate the relationship between crime rates and poverty levels in Riverside, California, during January 2002. The project involved geocoding address-based crime data, mapping socioeconomic variables, and analyzing spatial patterns to understand how social factors relate to crime geographically. This exercise strengthened my skills in geocoding, spatial data management, and interpreting real-world social trends through GIS mapping.
Assignment 4 – Crime and Poverty in Norfolk, VA (2010)
For this assignment, I created a map analyzing the relationship between crime rates and poverty levels in Norfolk, Virginia, using data from 2010. Building on skills from earlier exercises, I gathered census shapefiles, geocoded address-based crime data, and edited datasets to visualize how social and geographic factors influenced crime patterns. This project deepened my experience in data collection, spatial analysis, and using GIS to study social and criminological trends.
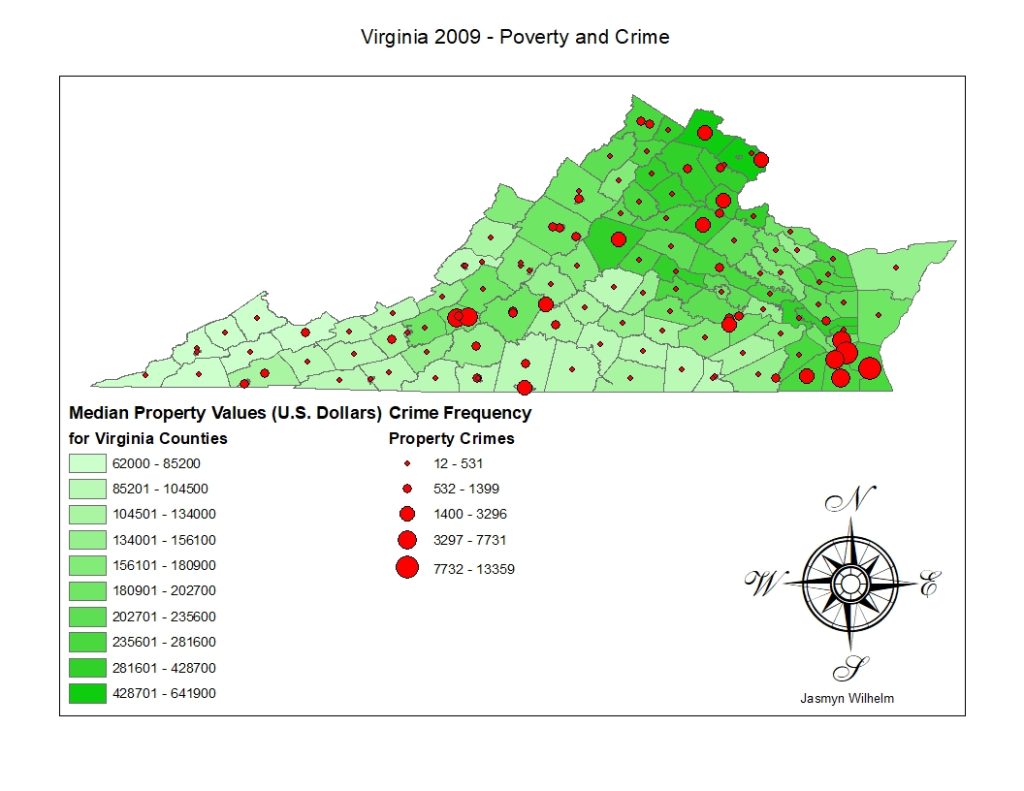
Assignment 5 – Poverty and Crime in Virginia Counties (2009)
For this assignment, I created a map analyzing the relationship between poverty levels and crime rates across counties in Virginia using 2009 data. The project involved gathering shapefiles and census data, integrating multiple datasets, and using ArcGIS tools to visualize and compare geographic patterns of poverty and crime at the county level. This assignment built on previous projects by applying spatial analysis techniques to broader regional data.
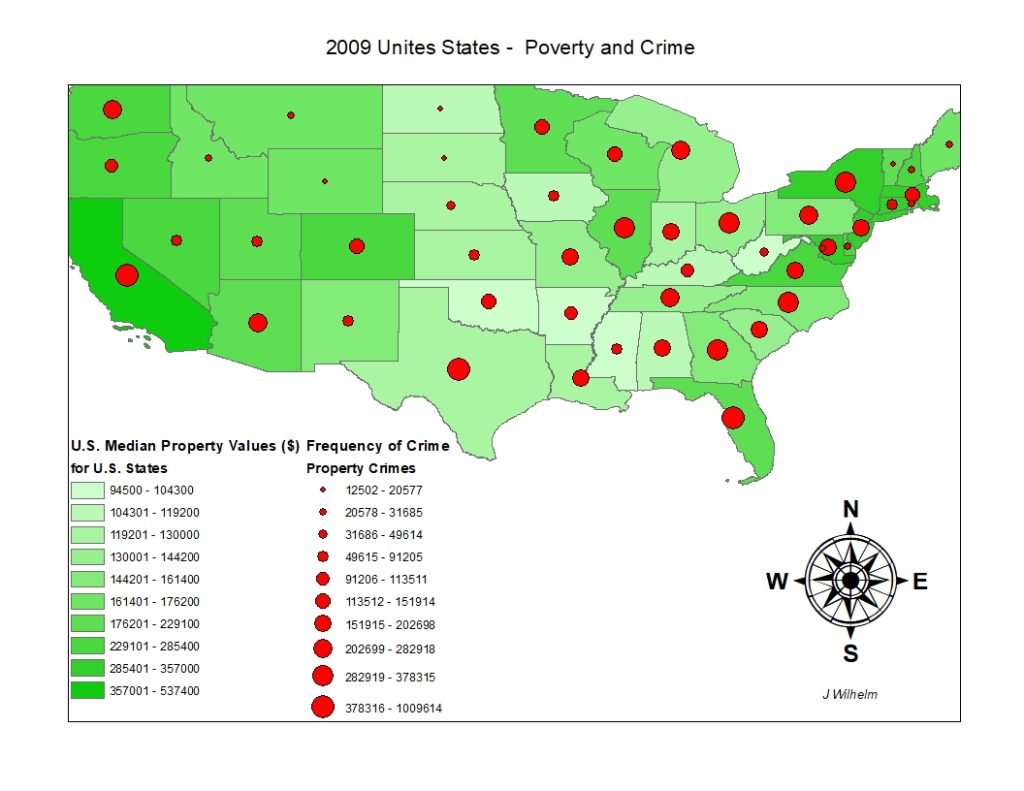
Assignment 6 – Poverty and Crime in U.S. States (2009)
For this assignment, I created a map analyzing the relationship between poverty levels and crime rates across all U.S. states using 2009 data. Building on the skills developed in previous projects, I gathered national census shapefiles and socioeconomic data, integrated multiple datasets, and used ArcGIS tools to visualize patterns of poverty and crime at the national level. This assignment expanded my spatial analysis experience to a broader geographic scale.
Quiz 2 – African-American Poverty in New Orleans and Riverside, CA School Placement
For this quiz, I created two maps using ArcGIS. The first map visualized the relationship between African-American poverty rates in New Orleans from 1970 to post-Hurricane Katrina flooding. The second map analyzed school placement in Riverside, California, based on school type and address data. This project required independent application of GIS mapping techniques, geocoding, data management, and spatial analysis skills developed throughout the course.