The Census Tract data (i.e. population with a disability) will be combined with the storm surge data (i.e. category 2) to estimate the approximate amount of people affected by the occurrence of high water levels.
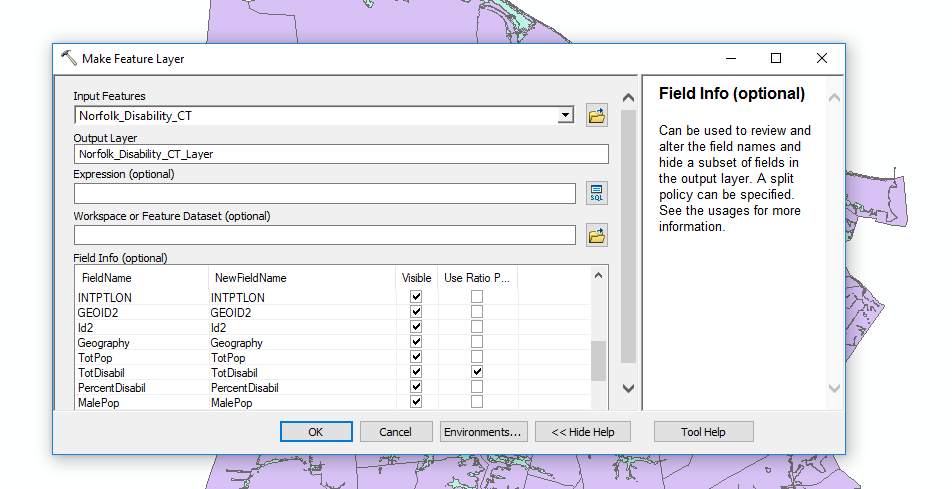
1.- Use the “Make Feature Layer” tool and check the “Use Ratio Policy” box for the desired variables (i.e. Tot Disability).
2.- Use the “intersect” tool as shown in the image below,

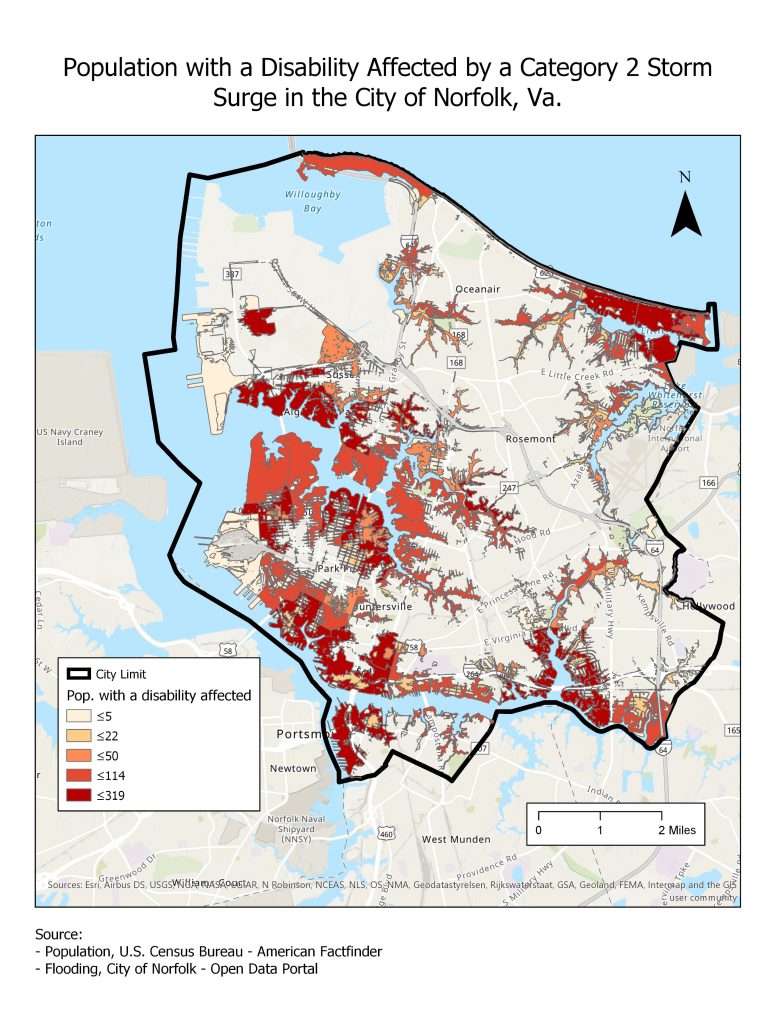
3.- Map showing the output of above steps,