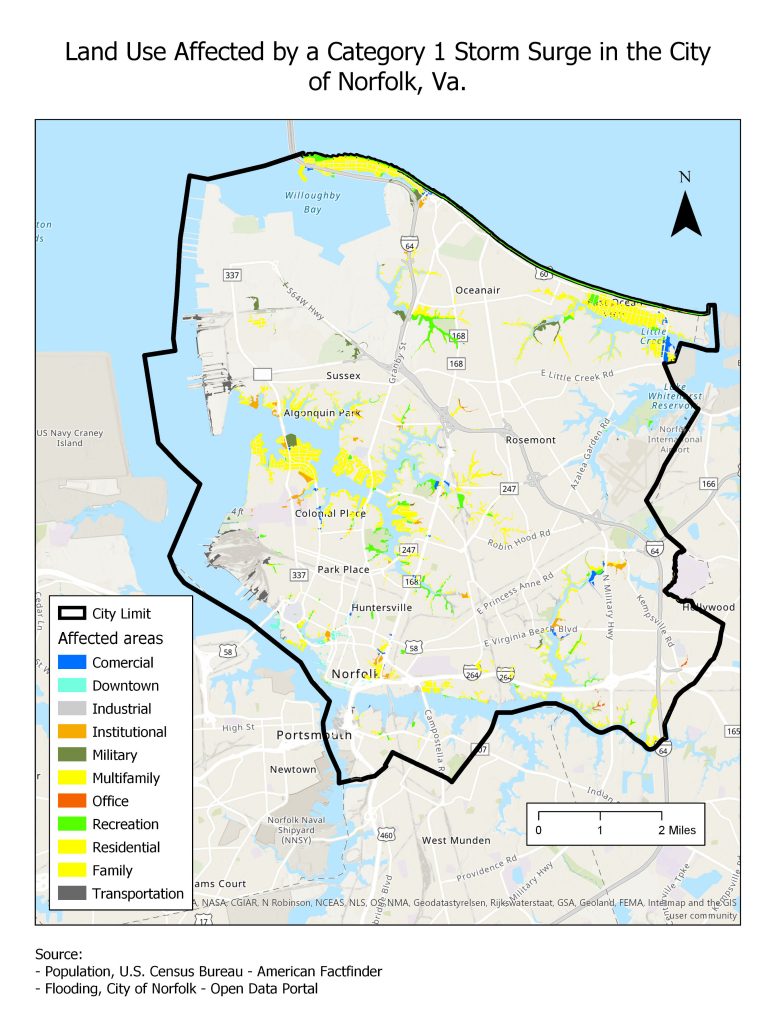
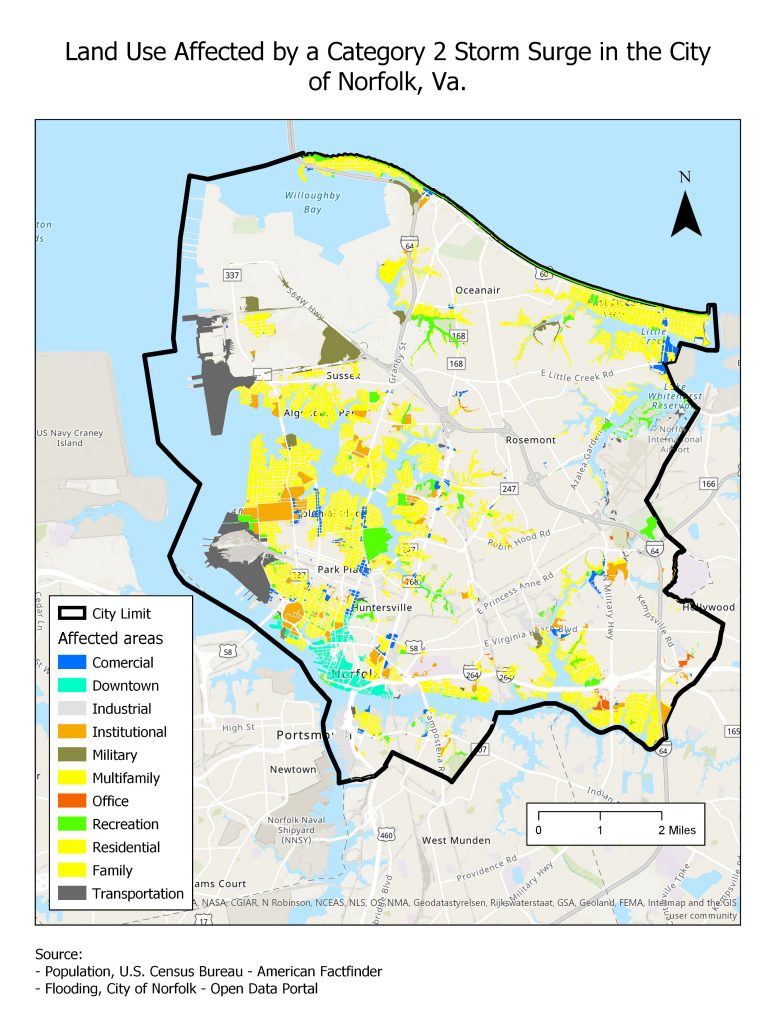
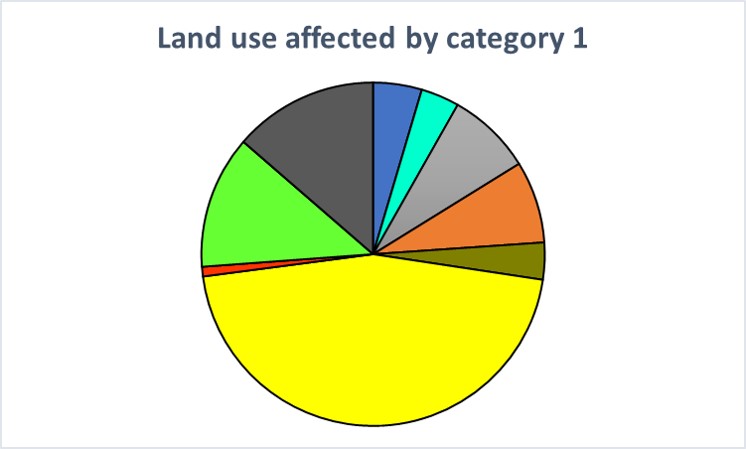
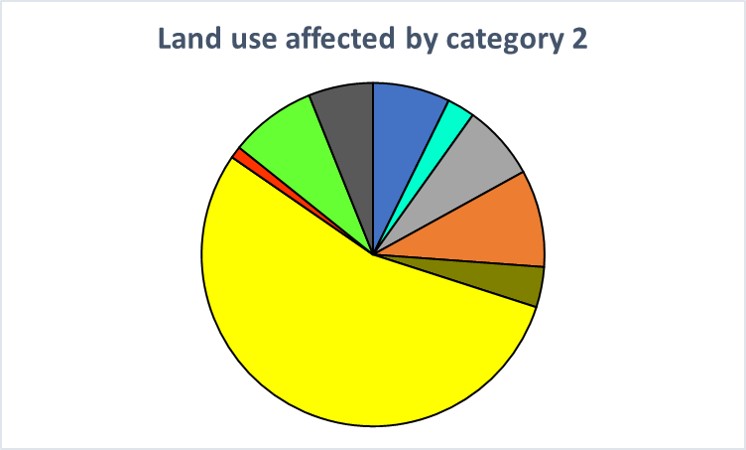
Maps below show the type of land used affected by storm surge of categories one (left) and two (right) in Norfolk, Va. The graphics below each map represent the percentage of each of type of land use affected. In both scenarios, “Housing (yellow)” is the land use with the higher percentage of affectation. However, it goes from about 45% in a category one to about 54% during a more intense storm surge. This indicates the dominance of this type of land use in the City of Norfolk.
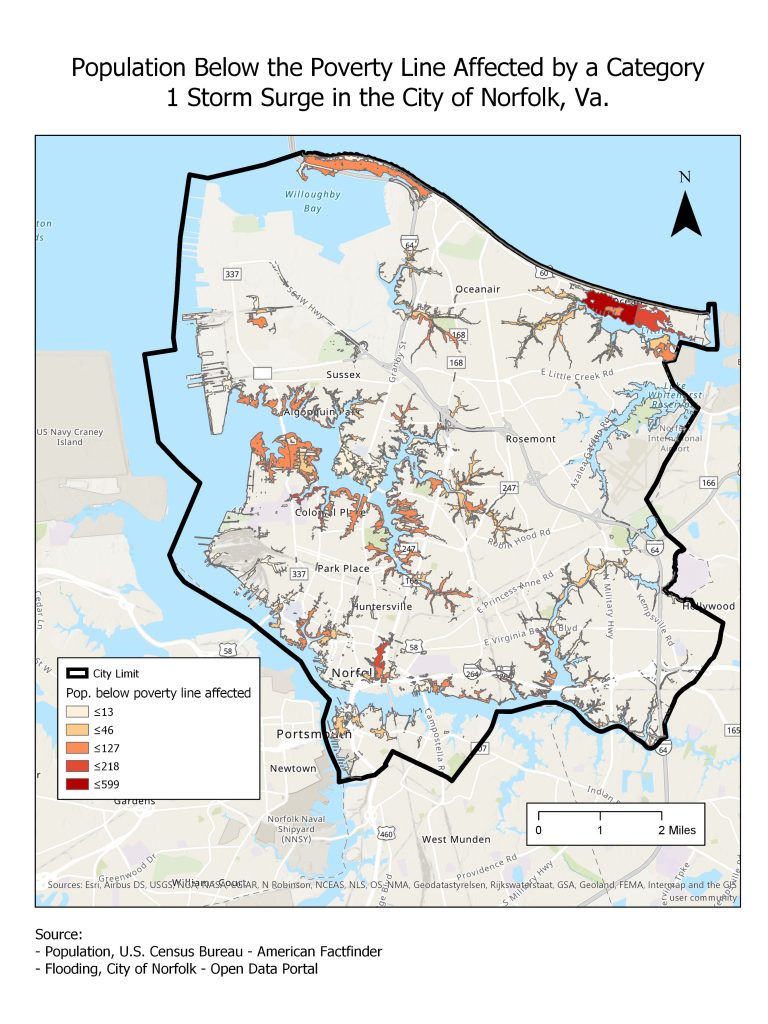
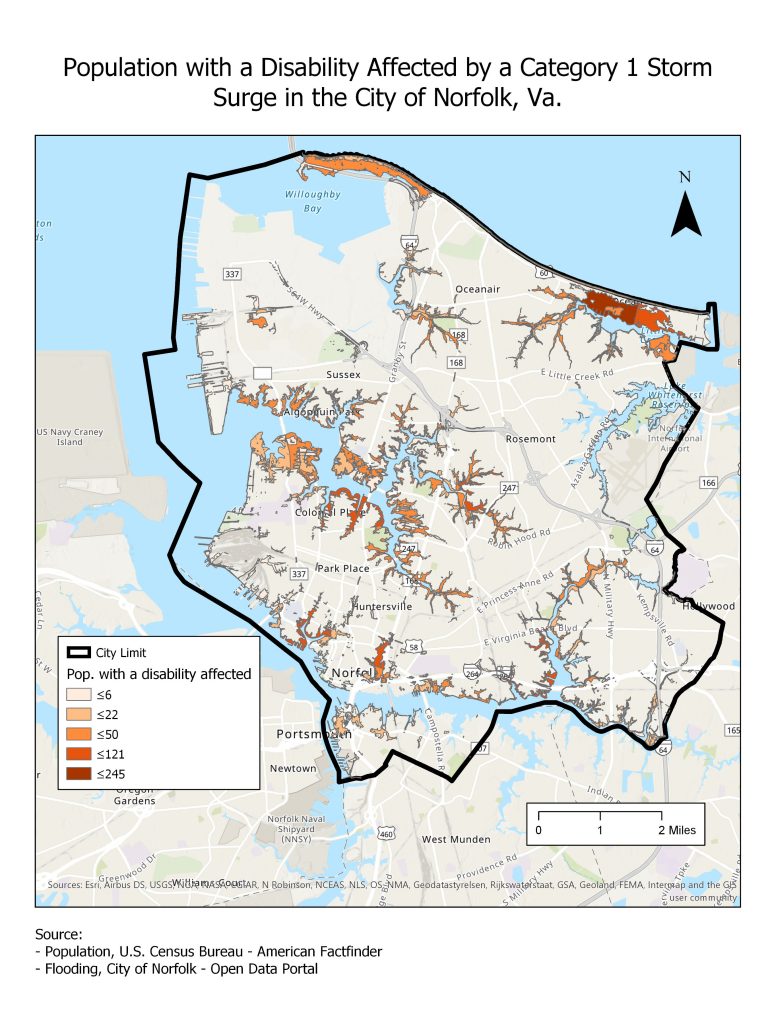
Similar analysis can be done with other data. For instance, maps below show the effects of storm surge (category 1) on total population, population below the poverty line, and population with disability in Norfolk, VA.