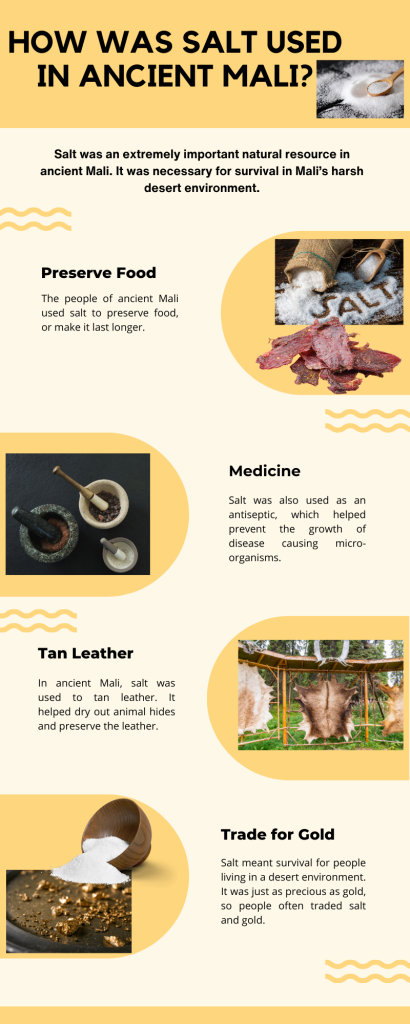
Infographics are visuals used to represent information. I used Canva to create my infographic (below) about how salt was used in ancient Mali, which is part of a 3rd grade standard (ancient civilizations) in social studies. It took me a while to find a template I could use to make my infographic. I wanted the color scheme to have some desert like colors, which is why I went with a template that used combinations of yellow. It has a somewhat monochromatic scheme using various shades of yellow at different levels of saturation (Reynolds, 2014). Another challenge I ran into was finding pictures to go with my obscure topic. Surprisingly, Canva offered some appropriate options I could use to further represent my information. A final challenge I had was sizing and spacing of the text and pictures. It can be difficult to make everything aesthetically pleasing to the eye. Sizing, spacing, and placement took the longest to get just right on my infographic.
I would encourage any student creating their own infographic to just keep working at it. Some infographics can be created quickly without much of an issue, but others may take more time and effort. When creating an infographic, it is important to follow some sort of color scheme and to use a legible font (a reliable typeface), so the audience can focus on the information and not be distracted by crazy colors or fonts (Reynolds, 2014). There are so many fun tools to use on Canva, but it is important to show restraint when making an infographic. Too much visual noise will get in the way of the information and be distracting to the viewer (Reynolds, 2014).
Infographics can be used to depict information in a visual manner. I used it for content, which would work in a classroom or library for various content topics. One way to use an infographic in the library is to get students interested in certain books you may have in your library by making a ‘top five books to read list.’ A student could also use an infographic to present information on a particular research project. Infographics are a great way to visually engage an audience and have them learn at the same time.
Reference
Reynolds, G. (2014). Presentationzen design (2nd ed.). New Riders.
Constance, I love the thought you put into your infographic. Not only is it something that applies to an actual curriculum, but sticking to a desert theme, like you mentioned, is clever. Your infographic is straight to the point without being flashy, but is still creative. The idea of a ‘Top 5 Book List’ is a great one! I can image them all hung up in the library or posted on the library website as recommendations.
Constance,
I’m a history nerd so of course I thought it was very interesting! Simple and straightforward but kept my attention. I like that you put a lot of thought and effort in what you wanted your infographic to be about. Are infographics something you use regularly for every lesson? I love it!