
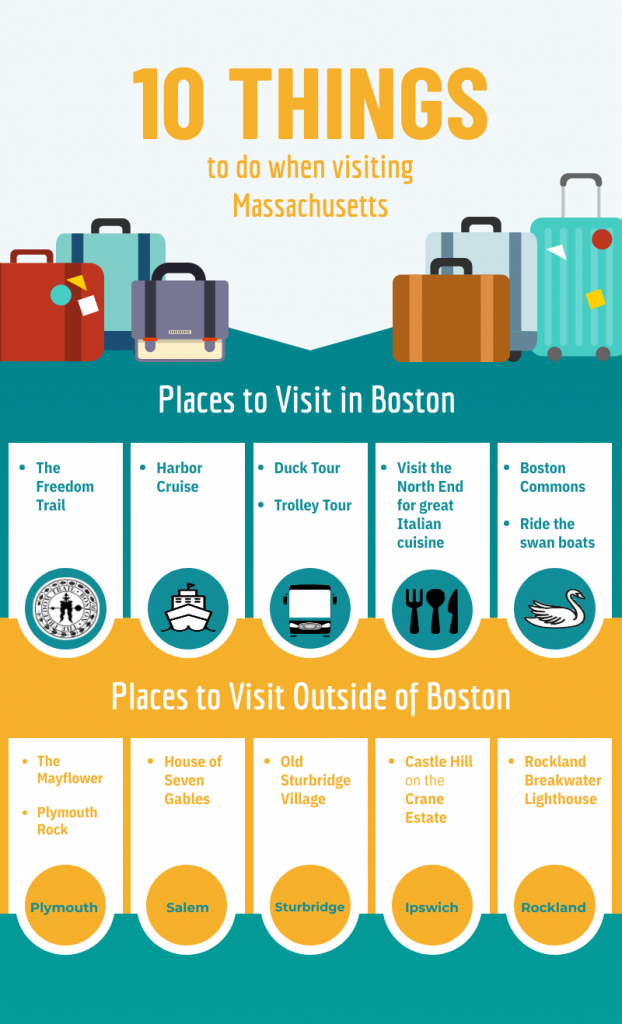
Using a Piktochart template, I created an infographic for visiting Massachusetts. I found Piktochart easy to use and manipulate. It had a lot of user friendly templates to choose from and once inside a template the layout and icons were pretty self explanatory. I really enjoyed their automatic palette creator and found it helped me not feel overwhelmed by all the color choices. I used the internet to find icons similar to what I was describing and used pages’ instant alpha to delete the photo’s background to create the icons I used in my infographic. I really enjoyed Piktochart and will definitely use it again.
I love the colors that you used on your infographic. It is really professional!
Hi Lisa, love this! It’s clear and organized, plus, I’m a little biased, I’m from RI so Boston is almost home for me.
This looks great!
Hi Lisa! Love what you did! So creative and informative. Boston is an amazing place to visit, was nice to a couple of extra items to do next time I’m there!
Lisa,
I also used Piktochart to create my infographic as well. I agree with you– the layout and formatting of Piktochart was also the easiest for me to use and manipulate in creating an effective infographic. Your infographic really fits all the different elements that Reynolds mentions in the text– regarding simplicity in portraying information with strong visuals!! Great job! Now, I have to take a road trip to Massachusetts to see all the exciting sites in Boston!
–Lauren Chubb