1) Essay (AI Tools and Budget Analysis in Business Analytics)
Prepared by: William Fulmer
Course: ENGL 307T– Digital Writing
Date: October 26, 2025
AI Tools and Budget Analysis in Business Analytics
In my future career as a business analyst, one of my primary responsibilities will be managing and analyzing spending data to identify trends and improve efficiency. In my current government logistics environment, this means tracking costs for consumable materials, repairable materials, and return-to-stow items. This type of work is important because it keeps operations financially accountable and helps leadership make more intelligent decisions about where funds are going. Usually, this process takes a long time: collecting data, cleaning it, calculating totals, and then turning it into visuals that make sense to others. With AI tools like ChatGPT and Excel Copilot, a lot of that manual work can be automated. These tools can create spreadsheets, generate formulas, and even build charts with just a few prompts, letting analysts focus more on interpretation rather than repetitive tasks.
Using AI to perform budget analysis speeds up the process but introduces new challenges. When I build a report manually, I have complete control, meaning I know exactly how the numbers were entered and calculated. With AI, I can type a prompt like, “Create a monthly spending report comparing consumable, repairable, and return-to-stow materials,” and get results almost instantly. That is a huge time saver, but it takes some practice to write clear prompts and to check twice that the results make sense. The hardest part is learning how to communicate with the AI so it understands the task the same way a human would. In short, it is faster, but it still requires attention to detail and critical thinking to ensure the information is accurate.
When generating the numbers in Excel by hand, the process took approximately 14 minutes and 34 seconds. This included converting handwritten data to a digital format, verifying each entry, and applying formulas to calculate totals. In contrast, when I used ChatGPT-5, the process was significantly faster. By taking a photo of the same handwritten data and prompting the AI with the request, “Please use the attached picture showing a wide range of data and incorporate this into an Excel spreadsheet,” the system produced a complete and accurate spreadsheet in roughly 20 seconds.
The reason this AI-generated spreadsheet is not included in the appendices is the way the data were initially collected. In a typical workflow, the data would already exist in a digital format such as Excel or a shared database, eliminating the need to transfer information from handwritten notes. Therefore, while this example effectively demonstrates the speed and accuracy of AI tools, it does not reflect the usual conditions under which data would be processed in a real-world operational environment.
When you look at this from a rhetorical perspective, AI changes how information is presented and received through ethos (credibility), logos (logic), and pathos (emotion). AI-generated reports usually look clean and professional, which can make them seem more credible at first glance. However, that credibility still depends on whether the analyst verifies the data and ensures it is correct. The logos appeal is strong with AI; it relies on data and structure to create logical, organized outputs. However, where AI falls short is in pathos and Kairos. It does not understand the real-world context behind why something happened. For example, if repairable material costs spike in August, AI might label it as an outlier. A human analyst, on the other hand, might know that a fleet-wide maintenance event caused that increase. As Ted Chiang explains in The Lifecycle of Software Objects (2010), AI lacks lived experience, so it lacks the context that humans naturally bring to their work. This theme is echoed again in Exhalation: Stories (Chiang, 2019), where he explores the limits of artificial intelligence and how human insight gives meaning to data and technology.
There is a clear difference between how humans and AI approach this kind of task. A human analyst focuses on the why behind the numbers, understanding what is driving costs and how they relate to the organization’s goals. AI, on the other hand, focuses on the what. What changed, what increased, what decreased. It can process and summarize data faster than I ever could, but it cannot yet explain the story behind it. That is where human insight comes in. AI can tell me repairable costs went up by 15%, but I am the one who can explain that it is due to a specific contract or mission requirement. In the end, AI is a powerful support tool, but it works best when combined with human judgment and context.
Using AI in business analytics raises some ethical questions, especially around data privacy, accuracy, and authorship. AI tools often require access to sensitive data, which means analysts must follow strict privacy and security guidelines. There is also the risk of overreliance on trusting AI results without verifying them. In a government setting, that could cause serious problems, especially if financial data is misrepresented. Another issue is authorship. If an AI tool helps create a report, should it be considered my original work? I believe AI should be viewed as a tool, not a replacement. It helps organize and display information, but I am still responsible for its accuracy and interpretation.
Looking back on this project, I see AI as a significant advantage for business analytics, but only when used correctly. Tools like ChatGPT and Excel Copilot save time, improve accuracy, and make reports more visually appealing. They do not replace human reasoning, but they do make the process more efficient. I have learned that the key is balance; letting AI handle the heavy lifting while I focus on understanding what the data means. Like Chiang pointed out, AI lacks lived experience, so it cannot fully grasp human context or motivation. In my future work, I will continue using AI to speed up analysis and automate routine tasks. However, I will always take responsibility for reviewing the results and ensuring they tell the whole story. That combination of AI efficiency with human insight is what makes data analysis both accurate and meaningful.
References
Chiang, T. (2010). The lifecycle of software objects. Subterranean Press.
Chiang, T. (2019). Exhalation: Stories. Alfred A. Knopf.
Appendices
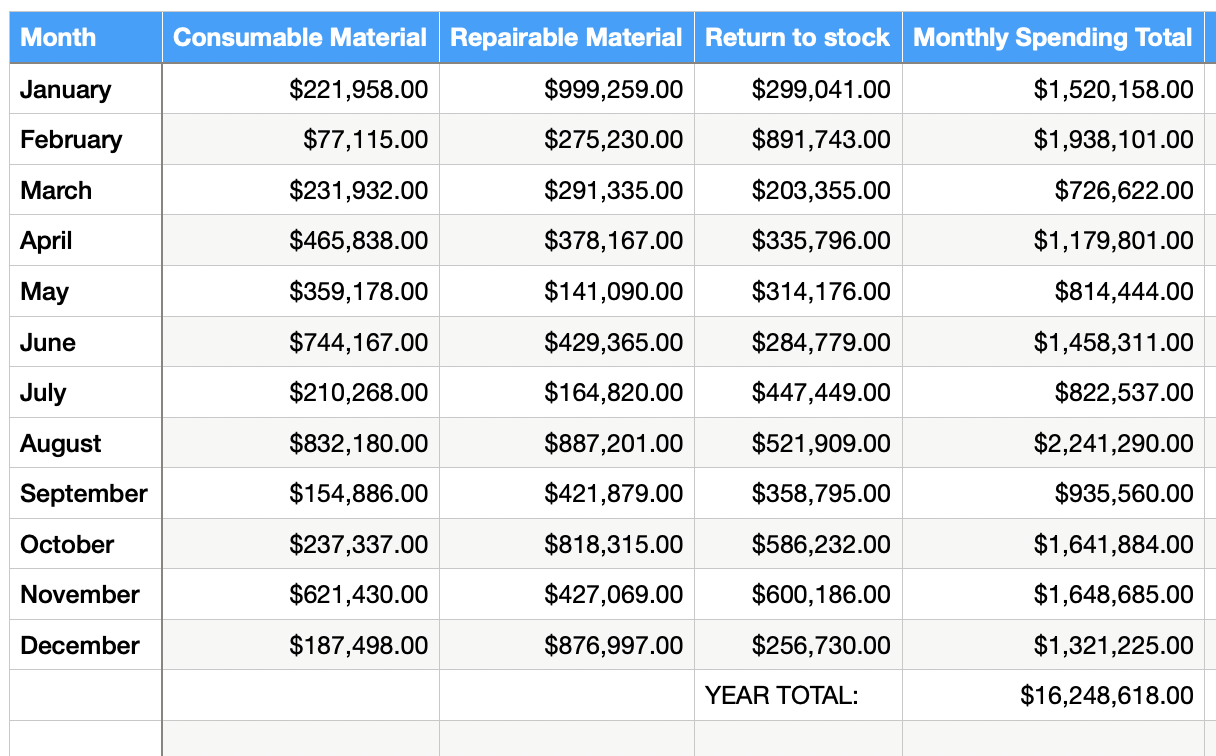
Appendix A – Data Collection (Modified for Security):
This appendix presents a 12-month dataset detailing spending by category (Consumable, Repairable, and Return to Stow). For government security and confidentiality purposes, all numerical figures have been modified; however, the structure and proportional relationships of the data accurately represent the original trends used in the analysis.
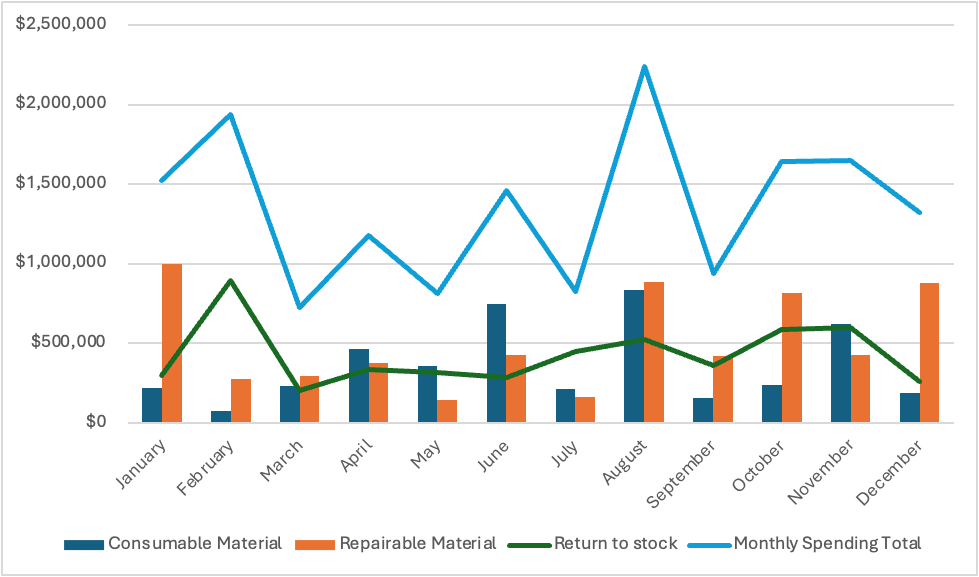
Appendix B – Human-Created Graph:
A graph was manually created in Excel in approximately one minute to illustrate monthly spending trends. This figure reflects the human process of data entry, formula application, and basic chart formatting to visualize spending distribution.
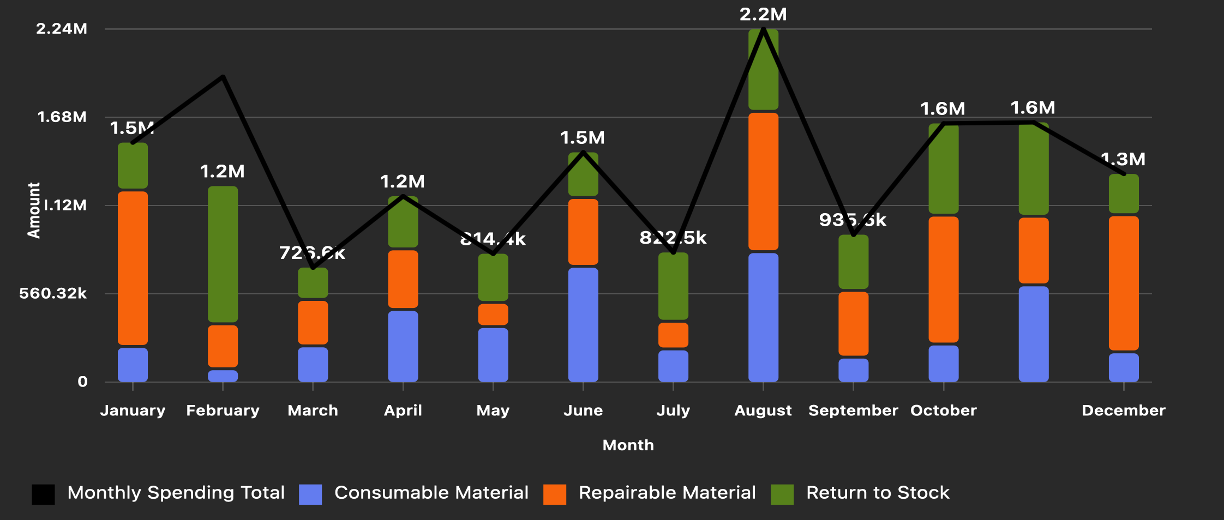
Appendix C – AI-Generated Graph (Excel Copilot):
A graph automatically generated by Excel Copilot using the same modified dataset. The AI-assisted version was completed in roughly ten seconds, demonstrating the speed and efficiency of automated data visualization tools compared to manual methods. However, upon closer inspection, it did miss including “November” when labeling the months.
Appendix A
Appendix B
Appendix C