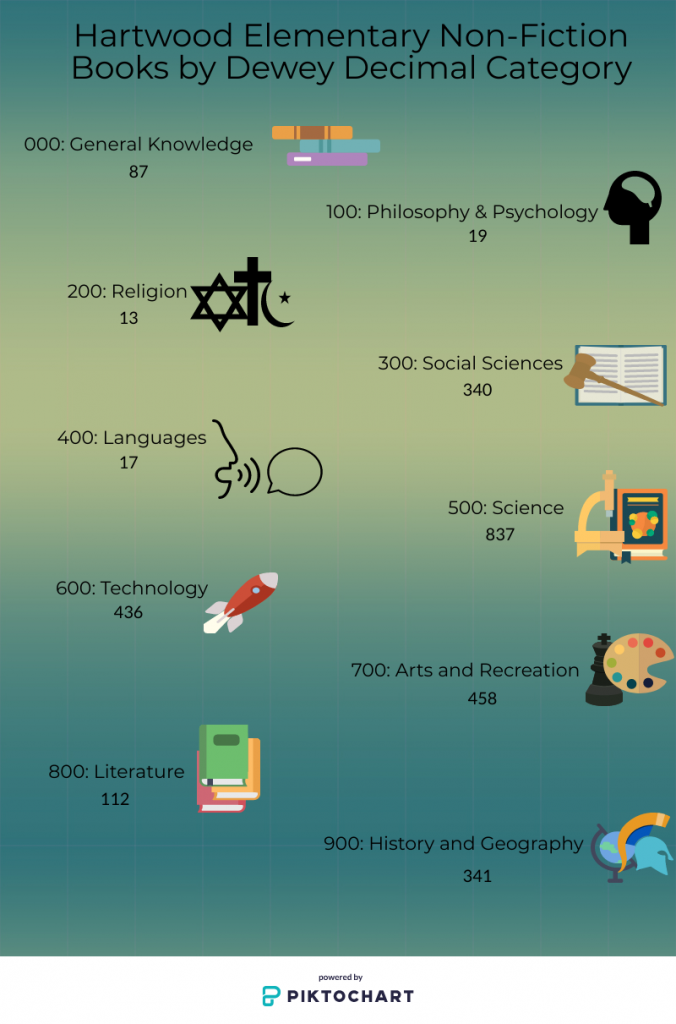
Here is an infographic I created to display the number of nonfiction books of each type in our Hartwood Elementary School Library collection. I’m just finishing up my end of year reports, so collection statistics are on my mind, and I decided to look at our our nonfiction collection by Dewey Decimal category. While I had fun playing with the tools in the sandbox this week, creating my own infographic was much harder than I thought it would be! I’m not artistic or creative by nature (literally only 4% based on a right-brain/left-brain quiz I just took;) and so I struggled to come up with something that was visually pleasing.
June 2, 2020 at 10:18 pm
I love your infographic! I think these may be my new favorite. I always wondered how they made them look so polished.
June 2, 2020 at 11:55 pm
Thanks, Beverly! This really was fun to play with.
June 3, 2020 at 4:12 am
Looks great! The symbols for each category are easily and quickly identifiable and help illustrate the categories well.
June 4, 2020 at 12:04 am
Thanks, Julie!!
June 3, 2020 at 5:40 pm
I like your infographic, it is simple but effective and visually appealing. I think we are all harder on ourselves than others.
I like your choices in your visual representations of the categories, they are appropriate and look good together but still offer a visually appealing variety of images without clashing.
How did you find the different infographic sites, as far as putting the infographic together? I used canva for my original inforgraphic and I really appreciated their templates and visual options, although I did find some of the actual putting together a little frustrating. I haven’t tried piktochart yet!
June 4, 2020 at 12:04 am
Thanks, Mary! I found piktochart to be the most user-friendly of our options, but I know canva is very popular and my school district is all about it!
June 7, 2020 at 1:54 am
I’m a frequent user of Canva, though I haven’t created infographics before. I opted to play with Piktochart and really liked that one too. I’ll be using it more next year, because it really is a great tool.
June 5, 2020 at 3:57 pm
Gray,
I really love this infographic! I think it could become a poster for student reference to help them find books in the library. The symbols you chose were a really smart choice. They are easily connected to the topic they represent.
June 7, 2020 at 1:18 pm
Thanks, Claire!