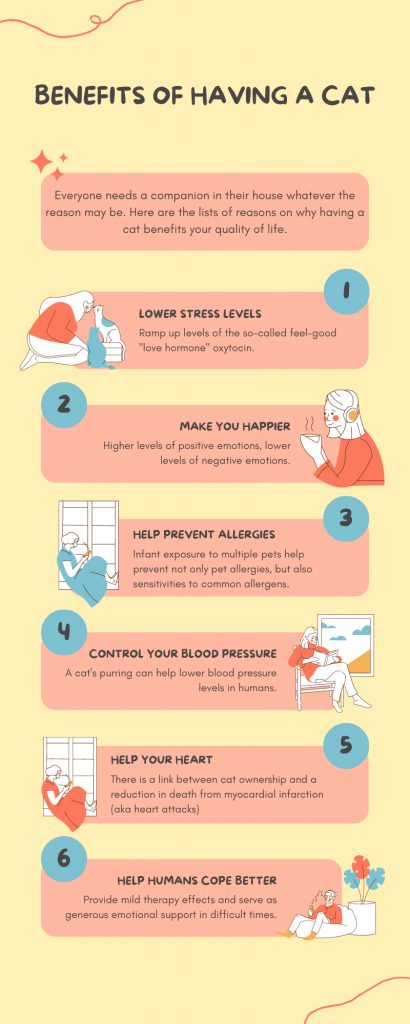
Infographics are great tools to simplify broad ideas for the viewer to read into. Rather than reading pages and pages of a study, some people prefer to see one simple poster that simplifies all the ideas into points. For this infographic, I used Canva as I was using Canva to create newsletters and flyers for my work which I thought was easy to use. Canva had multiple templates available already made. You don’t have to necessarily create an account to create one, but it would be better to create one so you could have access to your past designs that you created. There is a free version and a Pro version available. For the pro version, you have access to all the templates and don’t need to pay for images. If you are interested, there is a free trial where you can try it out and decide if you would like to start paying for a subscription. For what Canva offers, I would be happy to pay for a subscription if I would have the chance to use Canva for some reason in the future. Even without the Pro version, you have access to a lot of templates, stickers, fonts, and more so I would say the Pro version isn’t necessary in order to use this program. I created a draft infographic (as shown below), about the benefits of having a cat. The stickers were originally on the template, but I was able to change some stickers with the same drawing style so it wouldn’t be weird to suddenly have a different style image. I would love to use Canva as something to create a “How to…” poster in the library or classroom. Such as instructions on how to create a library card or how to behave in a library. It would great to include the many graphic pictures Canva allows us to use to make a visual effect for students.
There were two other programs that I tried using to create an infographic which was: Piktochart and Easel.ly.
Piktochart made me create an account to get access to it. As soon as I made an account, I was able to have access to a lot of different infographic templates. It was very similar to how Canva worked. There was a pro version as well which gives access to more templates and stickers. I honestly thought the interface of Canva was a bit more solid and easy to access. An interesting feature I found was the tool to change the color scheme. There are different color schemes you could choose for the whole template if you decide to change some colors as a whole. There are default ones and there is also one where you can choose the different colors yourself. I don’t recall Canva having this kind of feature which I thought was interesting.
Easel.ly did not require me to make an account. As a whole, I thought the interface and templates looked and felt a bit outdated. If I had to pick between the three programs, Easel.ly would be the one that I would pick last. There were many templates to pick out from, but as I mentioned, they seemed a bit outdated. But that may be just my personal preference I do not want it to affect how others feel about this program. This one also had an upgraded version if you wanted full access to all the tools. Just when seeing it as a free version, there were very limited graphics and templates that I could use in order to create an infographic that I would like. I think graphics are the most important things in an infographic and not being able to have access to that like the other two programs was a bit of a bummer for me.
June 5, 2022 at 11:05 pm
That’s a really creative infographic! I also like canva as a tool. Using an infographic for a “how to” is a great idea!
June 12, 2022 at 5:25 am
The infographic you chose has relaxing tones , which helps create a connection between the message of your post. I also agree , for what canva promotes I would consider upgrading to have more access and flexibility to create in the future.