Coastal geography and oceanographic sciences play a vital role in developing our undersanding of past, present and future sea level. Research in this area comprises the eustatic changes (absolute sea level changes arising from the ocean, global climate, and ice sheets), regional geologic subsidence (very high since the area bulged during the last glaciation and now subsides), and a variety of complex ocean dynamics with the Gulf Stream, wind-driven surges, and tides.
We base the future high tide on projections of Relative Sea Level Rise (RSLR) that combine the eustatic and vertical land motion. While the science improves with growing observations of ice sheets and ocean currents, we have increasing confidence to develop prudent policy and planning for sea level rise. The projections used for high tides of the Blue Line are based on the adopted Sea Level Rise planning horizons recommended by the Hampton Roads Coastal Resiliency Working Group and adopted by local cities to help assure regional parity and agreement on planning and projects. These RSLR amounts, relative to 2018, are 1.5ft as soon as 2050, 3ft as soon as 2080, and 4.5ft potentially by 2100.
About Tides
Shorelines are inherently dynamic and complex, and one can potentially map an infinite array of lines depending on your concern (shallow water for navigation, the lowest low tides, the highest high tides, the mean tide, or an average of tides over a 19yr period, known as Mean Sea Level.) For the Blue Line Project, we adopted the future high tides, as this benchmark shows an influence and geography that can really impact local neighborhoods, streets, and community assets. Technically, we are mapping and marking the future Mean Higher High Water (MHHW), an average of the higher of the high tides in the future. Hampton Roads has two tides per day, and our location relate to the Atlantic Ocean, wide and shallow contintental shelf, and meandering, funnel-shaped estuaries imparts a distinct local semi-diurnal tide where one of the high tides is higher than the other…every day. Since this higher high tide is more likely to affect us, the MHHW extent mapped as a shoreline at the high tide is the focus of the Blue Line.
What is a King Tide? Why should I care?
To understand a ”King tide,” a person must first understand what tides are in general. A king tide is a type of tide that is exceptionally high. King tides occur when the orbits and alignment of the Earth, moon, and sun combine. It is not a scientific term, but is a common term to describe such an occurrence. Tides are the alteration of the sea rising and falling and are affected by the movements of the sun and the moon. Throughout a 24-hour day there is a high and a low tide. The high and low tides can occur in three different ways. A diurnal tide is one high and low tide each day, semi-diurnal is two high and low tides each day, and finally a mixed tide is two high and low tides each day of different heights. The type of tide is determined though different factors like water depth, type of coastline, and the way the land is shaped. An important resource used to measure a king tide are tidal datums. Tidal datums are used as local vertical references to measure water levels.
One should remember, even though we already see tidal flooding on streets increasing on sunny days during the twice-year “spring” perigean tides in March and September-October, that current areas of tidal flooding will gradually increase in frequency and depth. In addition, areas that have not flooded from tides historically will begin to flood new areas. Although the Blue Line project focuses on only 3 areas of Norfolk the severity and impact of future tidal flooding will be much wider across Hampton Roads in the future. This tidal flooding will present challenges to streets, neighborhoods, accessibility and environmental quality. However, it also presents opportunities, such as demonstrating how to live with water, provide recreational and educational access, and encourge greener, nature-based solutions such as marsh restoration, living shorelines, and hybrid gray-green projects that can promote sustainable coastal communities (or at least, buy more time for communities.)
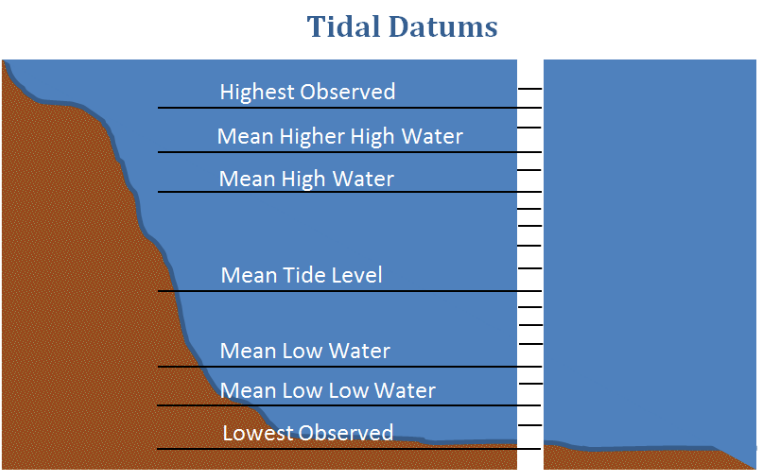
The mean higher high water mark (MHWW) in Fig. 1 is the average of the higher high water height that happen within a day for a coast like Hampton Roads with semi-diurnal tides. The MHHW mark is the average of all the high water heights. For the low water marks, it is the same process just using the lower tide water levels. It is important to know about tidal datums when discussing a king tide because king tides are typically around 1-1.5ft above typical daily high tides. So, by knowing the tidal datum information for a certain coastal location a person can observe and record accurate data during a king tide, and show the difference between the king tide water mark and the usual mean higher high water mark.
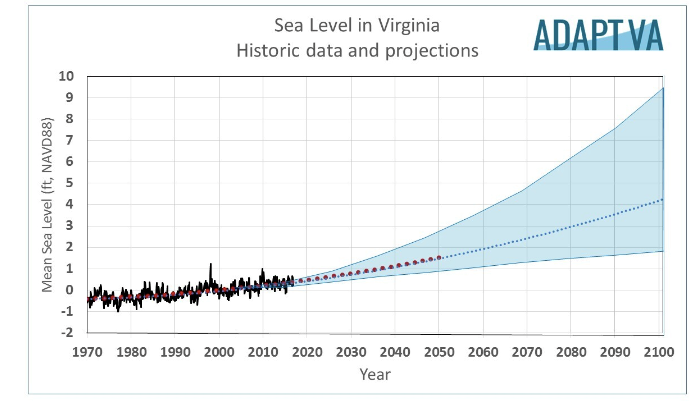
Figure 2 from the ADAPTVA website shows how there is a trend that mean sea levels have been rising throughout the years and are predicted to continue to rise. Houses, infrastructure, and other coastal developments will be affected by sea level rise. King tides give us a prediction on how sea level rise will look in the future, so by seeing what areas are affected by the king tide the community can identify future flood prone areas. By knowing this information, the community will know where not to build, how to adapt, and what areas need planning, mitigation or restoration.
Sea Level Rise and Tides
Old Dominion University faculty and other researchers have been aggressively investigating local and regional sea level rise and connections to global climate change. The ICAR SLR and Climate Science program has thrusts focusing on the climate and local geologic and oceanographic drivers of variability, which if better understood, can improve our prediction and economic design and adaptation to future flooding. Dr. Tal Ezer in ODU CCPO, for instance, has been investigating how the Gulf Stream has been slowed by hurricanes tracking along the Eastern Seaboard, exacerbating local flooding. Slowing of the Gulf Stream is also associated with broad-scale oscillations in the overturning of the Atlantic Ocean seawater. Other research has been examining the differential impacts of tidal flooding, extreme rainfall, and storm surges (as well as complex “combined” flooding from these hazards), such as Dr. Tom Allen’s work on the Port of Virginia and East Coast water infrastructure and Dr. Michael Allen’s analysis of extreme rainfall climatology becoming more extreme. To keep track of these changes and involve more faculty, students, and community in research, please visit the ICAR SLR and Climate Science program website cited below.
Authors: Cameron Kannan (ODU Geography Major, for GEOG 422W Coastal Geography, Fall 2019, and Dr. Tom Allen)
Sources and More Information:
ODU Institute for Coastal Adaptation and Resilience (ICAR), Sea Level Rise and Climate Science Program, https://oduadaptationandresilience.org/initiatives/sea-level-rise-climate-science/
NOAA Seasonal High Tide Bulletins https://oceanservice.noaa.gov/news/high-tide-bulletin/welcome.html
Tide Forecasts and Water Levels at NOAA’s Sewells Point Tide Gage, Norfolk
US Department of Commerce, N. O. A. A., & National Oceanic and Atmospheric Administration. (2017, May 4). What is a King Tide? Retrieved from https://oceanservice.noaa.gov/facts/kingtide.html.
NOAA Oceanic and Atmospheric Administration. (2013, June 1). What are tides? Retrieved from https://oceanservice.noaa.gov/facts/tides.html.
KING TIDES. (2011, June). Retrieved from https://www.epa.gov/sites/production/files/2014-04/documents/king_tides_factsheet.pdf.
ADAPTVA Forecasts and Trends Sea Level Report Cards. http://adaptva.com/info/forecasts.html
Ezer, T. 2019. Numerical modeling of the impact of hurricanes on ocean dynamics: Sensitivity of the Gulf Stream response to storm’s track. Ocean Dynamics. 69(9):1053-1066. doi:10.1007/s10236-019-01289-9.
Allen, T.R., T. Crawford, B. Montz, J. Whitehead, S. Lovelace, A. Hanks, A. Christensen, and, G. Kearney. 2019. Linking water infrastructure, public health, and sea level rise: Integrated assessment of flood resilience in coastal cities. Public Works Management and Policy. 24(1):110-139. doi.org/10.1177/1087724X18798380
Allen, M.J. and T.R. Allen. 2019. Precipitation trends across the Commonwealth of Virginia (1947-2016). Virginia Journal of Science. 70(1), article 4. DOI: 10.25778/3cay-z849 Available at: https://digitalcommons.odu.edu/vjs/vol70/iss1/4