By Mel Frizzell, Special Collections Assistant
In December 1977, the Norfolk Unitarian-Universalist Gay Caucus (UUGC) undertook what may have been the first survey of the LGBT community in Hampton Roads. The survey was not intended to be a complete profile of the local gay community as those surveyed tended to be either bar goers or those active in the local Gay and Lesbian community. Questions pertaining to the local Trans community were virtually non-existent. Surveys were distributed in local gay bars including the Cue, the Nickelodeon, the Late Show, the Ritz, and at UUGC meetings. The results of the survey were released in the January, February, March, and April 1978 issues of Our Own Community Press. The January issue gave an overview of results. The February issue featured the results as they pertained to women / Lesbians who took the survey. The March issue shared results pertaining to gay and bisexual men. The April issue highlighted comments made by survey respondents.

According to the February 1978 issue of Our Own, “The typical woman who filled out one of the UUGC questionnaires… is between 18 and 24 years old, lives in Norfolk, is registered to vote, Protestant, makes between $5-10,000, rents, has some college education, considers herself exclusively gay, attends a gay bar once a week, and always feels good about her sexuality.” A total of 86 women responded to the survey.
Older women were not well represented in the survey. 69% of the women surveyed were under the age of 24, and an additional 29% were between the ages of 25 and 34. Only 2% of the women were over the age of 34. Half of these respondents were from Norfolk, and the rest were from other cities in Hampton Roads with ten respondents from outside the area. Two thirds of these women were registered to vote. Political affiliation was not reported, but religious affiliation was. Nearly half of the respondents identified as Protestant. Nearly a third were Catholic. A smaller number identified as Jewish, not religious, or other (including two who identified as witches). 48% of respondents had an annual income between $5,000-10,000, 29% had an income less than $5,000 a year. Very few respondents made over $15,000 a year. Only 14% of these women owned their own home; 68% rented, and 18% lived with parents, with a lover, or had other living arrangements. Only 14% of these women had college degrees, 43% had completed some college, 35% had only graduated high school. A very few women had advanced degrees or had not completed high school at all. The highest number of these women (20%) worked in service and blue-collar industries. 17.5% of respondents were students and another 17.5% worked in government jobs. Other jobs included healthcare, education, management, clerical jobs, merchandising, and artists. Very few women surveyed were lawyers, journalists, engineers, or housewives. 8% of those women surveyed were unemployed.
Of the women surveyed, 8% claimed to be exclusively heterosexual, 44% considered themselves exclusively homosexual, and others claimed varying degrees of bisexuality. Most of these women (84%) always or usually felt good about their sexuality. 14% had mixed feelings about their sexuality, and only one woman usually felt bad about her sexuality. No one claimed to always feel bad about their sexuality. 36% of the women surveyed went to gay bars once a week, 28% went to bars only once a month, and 25% went to gay bars more than once week. Only 22% of these women belonged to gay organizations, while 28% belonged to social groups; 20% to professional groups; 15% to political groups; 38% to special interest groups; and 13% to religious groups. 26% of the women surveyed did not belong to any organization at all.
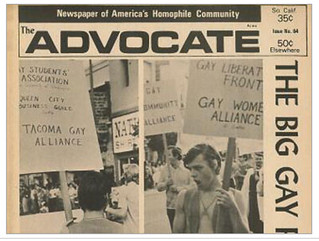
Popular LGBT publications among women were Our Own Community Press, The Advocate, Gay Blade, and Gay Community News. Only a small number read Lesbian publications such as Lesbian Connection or Lesbian Tide.

A total of 440 men answered the survey. This was over five times the response rate for women. The typical profile for men answering the survey was very similar to that of the women. The typical man answering the survey lived in Norfolk, was between the ages of 18 and 24, was registered to vote, rented their housing, had some college education, was Protestant, had an annual income of $5,000-10,000, considered themselves exclusively gay, and always felt good about their sexuality.
While the “typical” snapshot of respondents was similar, actual percentages varied and there were some differences between the men and women surveyed. The typical male (49.2%) went to gay bars more than once a week whereas the largest number of women (36%) only went to bars once a week. There was a larger number of men than women over the age of 24 who responded to the survey. There were more men over the age of 35 and even some over the age of 50. Men were less likely to have a religious affiliation at all, or if they did – to have a non-Christian affiliation (Jewish, Humanist, Buddhist, Moslem, B’ai H’ai, etc.). Twice as many men than women had completed college, and men generally had higher incomes. Women were slightly more likely be registered voters. Men were more likely to consider themselves “exclusively” homosexual than women, but women tended to overall to feel better about their sexuality. Men were more likely to belong to a gay organization or conversely to no organization at all than were women.
As for men’s statistics, 51.5% of men lived in Norfolk. 34.5% lived in other Hampton Roads cities. The remainder came from other places in Virginia, Washington DC, or from out of state. 54% of men were aged 18-24; 34% were 25-34; 9% were 35-49; and 1.5% were over age 50. 45% of male respondents identified as Protestant; 25.5% as Catholic; 15.0% as none; 7.0% as other; and 4.5% as Jewish. The highest percentages of men worked in either government or service jobs (16.2% and 16.4% respectively). Other higher percentage occupations included students (9.7%); management (7.7%); healthcare (7.4%); merchandising (7.4%); and other professionals (7.0%). Only 4.9% of men surveyed were unemployed. 65% of male respondents were registered to vote. 37% of those men surveyed had annual incomes between $5,000-10,000; 23.3% had annual incomes of $10,000-15,000; 17% had incomes over $15,000; and 20% had incomes under $5,000. 29.8 percent of the men surveyed had college degrees; 35.6% had some college; 27.8% had only graduated high school; and 5.9% did not have a high school diploma. 52.5% of men rented their housing; 21.0% owned their own home; and 23.5% had other living arrangements.
Of the men surveyed, 43.6% identified exclusively homosexual; 1.6% claimed to be exclusively heterosexual; and the rest claimed varying degrees of bisexuality. 79.6% of the men always or usually felt good about their sexuality; 18.7% felt both good and bad about their sexuality; and only 1.1% usually or always felt bad about their sexuality. Nearly half the men surveyed (49.2%) visited gay bars more than once a week; 25.5% visited gay bars weekly; 18.2% visited gay bars once a month or less; and of these only .7% never visited gay bars. 26% of the men surveyed belonged to gay organizations; 37.3% belonged to no organizations at all. Men also took part in professional organizations (27.3%), social organizations (26.2%), political organizations (14.1%), religious organizations (18.0%), and special interest groups (24.4%).
Popular publications among men included Our Own Community Press, The Advocate, In Touch, Gay Blade, Blueboy, Cruise, Gay Community News, Christopher Street, Gay Times, Eagle, GPU News, Drummer, Mandate, Playgirl, and After Dark.
While the demographics created a snapshot of LGBT bar goers and those active in the local LGBT community in 1977, the most revealing and sometimes entertaining portion of the survey were open-ended responses to the questions “What do you see as the greatest need of the lesbian/gay community of Tidewater?” Overall themes to these questions included the need for unity and a sense of gay community; gay and straight education on gay issues; politics and legislation for gay rights; acceptance and understanding; more and better bars; and social outlets other than the bars.
Comments included practical suggestions for the community – a Lesbian bar, live gay/lesbian music events, a gay military organization, a gay bookstore, a gay business association, an organization for aging gay men, a gay community center, and a gay church. All of these things have come to pass in Hampton Roads (at least at some point) since the 1977 survey. Some comments were idealistic like this one. “For them to learn to live together. To be friends no matter what color the person’s skin might be or what sex the person might be. To be openminded with everything, because being gay is hard enough without fighting each other.” Other idealistic responses included developing a unified gay/lesbian political philosophy, or ending division and labels within the community. Some comments focused on educating the public on gay/lesbian issues, helping gay and lesbian folks to feel better about themselves, and helping folks come out of the closet. There were also a few colorful comments by folks who obviously weren’t comfortable with segments of the gay/lesbian community at the time. “The flaunting of homosexuality is the major problem. The super “fags’ and ‘butch’ are what gives the rest of us bad names.” Another respondent suggested, “More Gay Bars!… Make anyone over 40 stay out! And have a special bar just for trolls.”
Since 1977, hopefully at least some things have changed for the better in the Hampton Roads LGBT community. Gay bookstores have come and gone, as have Lesbian bars. LGBT military organizations have formed, especially at the height of the gay military ban and “Don’t Ask, Don’t Tell.” We have an organization for aging Gay men, an LGBT business organization, and an LGBT community center. There’s an LGBT church, and even room at the annual Pride month Interfaith event for non-Christians and LGBT folks involved in non-traditional religions such as Wicca and Paganism. We have an LGBT Pride organization, an annual Pridefest, a Pride Boat Parade, and even a whole month of local Pride events. While not well represented in the 1977 survey, we now have organizations and events for Trans folks in our community too.
While we may have lost some things this past year or more due to Covid, this Pride month consider all that we have gained and learned since the early days of the Hampton Roads LGBT community. What will the Hampton Roads LGBT community be like 44 years from now?
You can browse the issues of Our Own Community Press mentioned in this blog post, as well as all other issues of Our Own, in our digital collections: https://dc.lib.odu.edu/digital/collection/ourown